使用 OpenTelemetry Collector 收集 Kubernetes 日志數據

前面我們介紹了如何通過 OpenTelemetry Collector 來收集 Kubernetes 集群的指標數據,接下來我們再來了解下如何收集集群的日志記錄數據。
安裝 Loki
首先我們需要部署 Loki 來收集日志數據,同樣我們這里使用 Helm Chart 來快速部署,不過需要注意同樣不需要部署任何日志采集器,因為我們將使用 OpenTelemetry Collector 來收集日志數據,然后再將其發送到 Loki 中。
$ helm repo add grafana https://grafana.github.io/helm-chart
$ helm repo update
我們這里創建一個 loki-values.yaml 文件來配置 Loki Helm Chart:
# loki-values.yaml
loki:
  commonConfig:
    replication_factor: 1
  auth_enabled: false
  storage:
    type: "filesystem"
singleBinary:
  replicas: 1
  persistence:
    enabled: true
    size: 10Gi
    storageClass: cfsauto
monitoring:
  lokiCanary:
    enabled: false
  selfMonitoring:
    grafanaAgent:
      installOperator: false
test:
  enabled: false
gateway:
  ingress:
    enabled: true
    ingressClassName: nginx
    tls: []
    hosts:
      - host: loki.k8s.local
        paths:
          - path: /
            pathType: Prefix
然后直接使用下面的命令一鍵部署 Loki 即可:
$ helm upgrade --install loki grafana/loki -f loki-values.yaml --namespace kube-otel
$ kubectl get pods -n kube-otel -l app.kubernetes.io/instance=loki
NAME                            READY   STATUS    RESTARTS   AGE
loki-0                          1/1     Running   0          3m52s
loki-gateway-5ffc9fbbf5-m5q75   1/1     Running   0          8m42s
$ kubectl get ingress -n kube-otel
NAME                 CLASS   HOSTS               ADDRESS       PORTS   AGE
loki-gateway         nginx   loki.k8s.local      10.98.12.94   80      11m
啟用 filelog 接收器
接下來我們就需要配置 OpenTelemetry Collector 來將日志數據發送到 Loki 中,首先更新 otel-collector-ds-values.yaml 文件,我們需要添加一個 Loki 的導出器,并開啟 filelogreceiver 接收器:
# otel-collector-ds-values.yaml
mode: daemonset

presets:
  hostMetrics:
    enabled: true
  kubernetesAttributes:
    enabled: true
  kubeletMetrics:
    enabled: true
  # 啟用 filelogreceiver 收集器
  logsCollection:
    enabled: true

config:
  exporters:
    loki:
      endpoint: http://loki-gateway/loki/api/v1/push
      timeout: 10s # 超時時間
      read_buffer_size: 200
      write_buffer_size: 100
      retry_on_failure: # 配置重試
        enabled: true
        initial_interval: 10s # 初始間隔
        max_interval: 60s # 最大間隔
        max_elapsed_time: 10m # 最大時間
      default_labels_enabled:
        exporter: false

  processors:
    resource:
      attributes:
        - action: insert
          key: loki.resource.labels
          value: k8s.namespace.name,k8s.pod.name,k8s.container.name

  service:
    pipelines:
      logs:
        exporters:
          - loki
        processors:
          - memory_limiter
          - k8sattributes
          - resource
          - batch
然后重新更新 OpenTelemetry Collector DaemonSet:
$ helm upgrade --install opentelemetry-collector ./opentelemetry-collector -f otel-ds-values.yaml --namespace kube-otel --create-namespace同樣更新后查看完整的配置信息,使用命令 kubectl get cm -n opentelemetry-collector-agent -oyaml:
exporters:
  logging:
    loglevel: debug
  loki:
    endpoint: http://loki-gateway/loki/api/v1/push
    timeout: 10s # 超時時間
    read_buffer_size: 200
    write_buffer_size: 100
    retry_on_failure: # 配置重試
      enabled: true
      initial_interval: 10s # 初始間隔
      max_interval: 60s # 最大間隔
      max_elapsed_time: 10m # 最大時間
    default_labels_enabled:
      exporter: false
extensions:
  health_check: {}
  memory_ballast:
    size_in_percentage: 40
processors:
  batch: {}
  k8sattributes:
    extract:
      metadata:
        - k8s.namespace.name
        - k8s.deployment.name
        - k8s.statefulset.name
        - k8s.daemonset.name
        - k8s.cronjob.name
        - k8s.job.name
        - k8s.node.name
        - k8s.pod.name
        - k8s.pod.uid
        - k8s.pod.start_time
    filter:
      node_from_env_var: K8S_NODE_NAME
    passthrough: false
    pod_association:
      - sources:
          - from: resource_attribute
            name: k8s.pod.ip
      - sources:
          - from: resource_attribute
            name: k8s.pod.uid
      - sources:
          - from: connection
  memory_limiter:
    check_interval: 5s
    limit_percentage: 80
    spike_limit_percentage: 25
  resource:
    attributes:
      - action: insert
        key: loki.resource.labels
        value: k8s.namespace.name,k8s.pod.name,k8s.container.name
receivers:
  filelog:
    exclude:
      - /var/log/pods/kube-otel_opentelemetry-collector*_*/opentelemetry-collector/*.log
    include:
      - /var/log/pods/*/*/*.log
    include_file_name: false
    include_file_path: true
    operators:
      - id: get-format
        routes:
          - expr: body matches "^\\{"
            output: parser-docker
          - expr: body matches "^[^ Z]+ "
            output: parser-crio
          - expr: body matches "^[^ Z]+Z"
            output: parser-containerd
        type: router
      - id: parser-crio
        regex: ^(?P<time>[^ Z]+) (?P<stream>stdout|stderr) (?P<logtag>[^ ]*) ?(?P<log>.*)$
        timestamp:
          layout: 2006-01-02T15:04:05.999999999Z07:00
          layout_type: gotime
          parse_from: attributes.time
        type: regex_parser
      - combine_field: attributes.log
        combine_with: ""
        id: crio-recombine
        is_last_entry: attributes.logtag == 'F'
        max_log_size: 102400
        output: extract_metadata_from_filepath
        source_identifier: attributes["log.file.path"]
        type: recombine
      - id: parser-containerd
        regex: ^(?P<time>[^ ^Z]+Z) (?P<stream>stdout|stderr) (?P<logtag>[^ ]*) ?(?P<log>.*)$
        timestamp:
          layout: "%Y-%m-%dT%H:%M:%S.%LZ"
          parse_from: attributes.time
        type: regex_parser
      - combine_field: attributes.log
        combine_with: ""
        id: containerd-recombine
        is_last_entry: attributes.logtag == 'F'
        max_log_size: 102400
        output: extract_metadata_from_filepath
        source_identifier: attributes["log.file.path"]
        type: recombine
      - id: parser-docker
        output: extract_metadata_from_filepath
        timestamp:
          layout: "%Y-%m-%dT%H:%M:%S.%LZ"
          parse_from: attributes.time
        type: json_parser
      - id: extract_metadata_from_filepath
        parse_from: attributes["log.file.path"]
        regex: ^.*\/(?P<namespace>[^_]+)_(?P<pod_name>[^_]+)_(?P<uid>[a-f0-9\-]+)\/(?P<container_name>[^\._]+)\/(?P<restart_count>\d+)\.log$
        type: regex_parser
      - from: attributes.stream
        to: attributes["log.iostream"]
        type: move
      - from: attributes.container_name
        to: resource["k8s.container.name"]
        type: move
      - from: attributes.namespace
        to: resource["k8s.namespace.name"]
        type: move
      - from: attributes.pod_name
        to: resource["k8s.pod.name"]
        type: move
      - from: attributes.restart_count
        to: resource["k8s.container.restart_count"]
        type: move
      - from: attributes.uid
        to: resource["k8s.pod.uid"]
        type: move
      - from: attributes.log
        to: body
        type: move
    start_at: beginning
  otlp:
    protocols:
      grpc:
        endpoint: ${env:MY_POD_IP}:4317
      http:
        endpoint: ${env:MY_POD_IP}:4318
service:
  extensions:
    - health_check
    - memory_ballast
  pipelines:
    logs:
      exporters:
        - loki
      processors:
        - memory_limiter
        - k8sattributes
        - resource
        - batch
      receivers:
        - otlp
        - filelog
# 同樣只保留了和 logs 相關的配置,其他省略......
我們新增加了一個 loki 的導出器以及 filelog 接收器。
loki 導出器
該導出器是通過 HTTP 將數據導出到 Loki。該導出器可以做以下一些配置:
- endpoint:Loki 的 HTTP 端點地址(如 http://loki:3100/loki/api/v1/push)。
- default_labels_enabled(可選):允許禁用默認標簽的映射:exporter、job、instance、level。如果省略default_labels_enabled,則會添加默認標簽。如果在 default_labels_enabled 中省略了其中一個標簽,則會添加該標簽。
如果禁用了所有默認標簽,并且沒有添加其他標簽,則日志條目將被丟棄,因為至少需要存在一個標簽才能成功將日志記錄寫入 Loki 中。指標 otelcol_lokiexporter_send_failed_due_to_missing_labels 將會顯示由于未指定標簽而被丟棄的日志記錄數量。
Loki 導出器可以將 OTLP 資源和日志屬性轉換為 Loki 標簽,并對其進行索引。為此,需要配置提示,指定應將哪些屬性設置為標簽。提示本身就是屬性,在導出到 Loki 時將被忽略。以下示例使用 attributes 處理器提示 Loki 導出器將 event.domain 屬性設置為標簽,并使用 resource 處理器提示 Loki 導出器將 service.name 設置為標簽。
processors:
  attributes:
    actions:
      - action: insert
        key: loki.attribute.labels
        value: event.domain

  resource:
    attributes:
      - action: insert
        key: loki.resource.labels
        value: service.name
除非通過 default_labels_enabled 設置禁用,默認標簽始終會被設置。
- job=service.namespace/service.name
- instance=service.instance.id
- exporter=OTLP
- level=severity
如果 service.name 和 service.namespace 存在,那么設置 job=service.namespace/service.name。如果 service.name 存在且 service.namespace 不存在,則會設置 job=service.name。如果 service.name 不存在且 service.namespace 存在,則不會設置 job 標簽。如果存在 service.instance.id 則設置 instance=service.instance.id。如果 service.instance.id 不存在,則不設置 instance 標簽。
我們這里的完整配置如下:
loki:
  endpoint: http://loki-gateway/loki/api/v1/push
  timeout: 10s # 超時時間
  read_buffer_size: 200
  write_buffer_size: 100
  retry_on_failure: # 配置重試
    enabled: true
    initial_interval: 10s # 初始間隔
    max_interval: 60s # 最大間隔
    max_elapsed_time: 10m # 最大時間
我們這里配置了超時時間,讀寫緩沖區大小,發送隊列,重試等。
read_buffer_size 和 write_buffer_size 字段分別指定了 OpenTelemetry 導出器的讀取和寫入緩沖區的大小。這些緩沖區用于在發送數據之前緩存數據,以提高發送效率和可靠性。
read_buffer_size 字段指定了導出器從數據源讀取數據時使用的緩沖區大小。如果數據源產生的數據量超過了緩沖區的大小,導出器將分批讀取數據并將其緩存到緩沖區中,直到緩沖區被填滿或數據源沒有更多數據為止。
write_buffer_size 字段指定了導出器將指標數據寫入目標時使用的緩沖區大小。如果導出器產生的數據量超過了緩沖區的大小,導出器將分批將數據寫入目標,并將其緩存到緩沖區中,直到緩沖區被填滿或目標不可用為止。
通過配置這些緩沖區的大小,您可以控制 OpenTelemetry 導出器的性能和可靠性。如果您的數據源產生的數據量很大,可以增加 read_buffer_size 和 write_buffer_size 的大小,以提高導出器的吞吐量和效率。如果您的目標不太穩定或網絡不太可靠,可以減小 write_buffer_size 的大小,以減少數據丟失的風險。
另外添加了一個resource的處理器,將 k8s.namespace.name、k8s.pod.name、k8s.container.name 轉換為 Loki 標簽,這樣我們就可以在 Loki 中對其進行索引了。
resource:
  attributes:
    - action: insert
      key: loki.resource.labels
      value: k8s.namespace.name,k8s.pod.name,k8s.container.name
filelog 接收器
該接收器用于從文件中收集并解析日志數據,它會從指定的文件中讀取日志數據,然后將其發送到 OpenTelemetry Collector 中。
我們這里對該接收器的配置如下所示:
filelog:
  exclude:
    - /var/log/pods/kube-otel_opentelemetry-collector*_*/opentelemetry-collector/*.log
  include:
    - /var/log/pods/*/*/*.log
  include_file_name: false
  include_file_path: true
  operators:
    - id: get-format
      routes:
        - expr: body matches "^\\{"
          output: parser-docker
        - expr: body matches "^[^ Z]+ "
          output: parser-crio
        - expr: body matches "^[^ Z]+Z"
          output: parser-containerd
      type: router
    - id: parser-crio
      regex: ^(?P<time>[^ Z]+) (?P<stream>stdout|stderr) (?P<logtag>[^ ]*) ?(?P<log>.*)$
      timestamp:
        layout: 2006-01-02T15:04:05.999999999Z07:00
        layout_type: gotime
        parse_from: attributes.time
      type: regex_parser
    - combine_field: attributes.log
      combine_with: ""
      id: crio-recombine
      is_last_entry: attributes.logtag == 'F'
      max_log_size: 102400
      output: extract_metadata_from_filepath
      source_identifier: attributes["log.file.path"]
      type: recombine
    - id: parser-containerd
      regex: ^(?P<time>[^ ^Z]+Z) (?P<stream>stdout|stderr) (?P<logtag>[^ ]*) ?(?P<log>.*)$
      timestamp:
        layout: "%Y-%m-%dT%H:%M:%S.%LZ"
        parse_from: attributes.time
      type: regex_parser
    - combine_field: attributes.log
      combine_with: ""
      id: containerd-recombine
      is_last_entry: attributes.logtag == 'F'
      max_log_size: 102400
      output: extract_metadata_from_filepath
      source_identifier: attributes["log.file.path"]
      type: recombine
    - id: parser-docker
      output: extract_metadata_from_filepath
      timestamp:
        layout: "%Y-%m-%dT%H:%M:%S.%LZ"
        parse_from: attributes.time
      type: json_parser
    - id: extract_metadata_from_filepath
      parse_from: attributes["log.file.path"]
      regex: ^.*\/(?P<namespace>[^_]+)_(?P<pod_name>[^_]+)_(?P<uid>[a-f0-9\-]+)\/(?P<container_name>[^\._]+)\/(?P<restart_count>\d+)\.log$
      type: regex_parser
    - from: attributes.stream
      to: attributes["log.iostream"]
      type: move
    - from: attributes.container_name
      to: resource["k8s.container.name"]
      type: move
    - from: attributes.namespace
      to: resource["k8s.namespace.name"]
      type: move
    - from: attributes.pod_name
      to: resource["k8s.pod.name"]
      type: move
    - from: attributes.restart_count
      to: resource["k8s.container.restart_count"]
      type: move
    - from: attributes.uid
      to: resource["k8s.pod.uid"]
      type: move
    - from: attributes.log
      to: body
      type: move
  start_at: beginning
可以看到配置非常長,首先通過 exclude 排除一些不需要收集的日志文件,然后通過 include 指定了需要收集的日志文件,由于我們的 Kubernetes 集群是基于 Containerd 容器運行時的,所以采集的日志目錄為 /var/log/pods/*/*/*.log,然后通過 include_file_path 來指定是否將文件路徑添加為屬性 log.file.path,include_file_name 指定是否將文件名添加為屬性 log.file.name。
start_at 表示在啟動時,從文件的哪個位置開始讀取日志。選項有 beginning 或 end,默認為 end。
然后就是最重要的 operators 屬性,用來指定如何處理日志文件,運算符是日志處理的最基本單元。每個運算符都完成一個單一的責任,比如從文件中讀取行,或者從字段中解析 JSON。然后,這些運算符被鏈接在一起,形成一個管道,以實現所需的結果。
例如用戶可以使用 file_input 操作符從文件中讀取日志行。然后,這個操作的結果可以發送到 regex_parser 操作符,根據正則表達式創建字段。最后,這些結果可以發送到 file_output 操作符,將日志寫入到磁盤上的文件中。
我們這里首先配置了一個 router 操作符:
id: get-format
routes:
  - expr: body matches "^\\{"
    output: parser-docker
  - expr: body matches "^[^ Z]+ "
    output: parser-crio
  - expr: body matches "^[^ Z]+Z"
    output: parser-containerd
type: router
該操作符允許根據日志內容動態路由日志,我們這里是 Containerd 的容器運行時,產生的日志數據可以匹配 body matches "^[^ Z]+Z",然后將數據路由到 parser-containerd 操作符。
id: parser-containerd
regex: ^(?P<time>[^ ^Z]+Z) (?P<stream>stdout|stderr) (?P<logtag>[^ ]*) ?(?P<log>.*)$
timestamp:
  layout: "%Y-%m-%dT%H:%M:%S.%LZ"
  parse_from: attributes.time
type: regex_parser
parser-containerd 是一個 regex_parser 操作符,它使用指定的正則表達式來解析前面路由過來的日志數據,然后會將結果存儲在 time、stream、logtag、log 等屬性中,并格式化 timestamp 時間戳。
接下來再通過 recombine 操作符將連續的日志組合成單個日志。
combine_field: attributes.log
combine_with: ""
id: containerd-recombine
is_last_entry: attributes.logtag == 'F'
max_log_size: 102400
output: extract_metadata_from_filepath
source_identifier: attributes["log.file.path"]
type: recombine
經過上面處理后進入 extract_metadata_from_filepath 這個操作符,該操作符使用正則表達式從文件路徑中提取元數據,然后將其存儲在 namespace、pod_name、uid、container_name、restart_count 等屬性中。
id: extract_metadata_from_filepath
parse_from: attributes["log.file.path"]
regex: ^.*\/(?P<namespace>[^_]+)_(?P<pod_name>[^_]+)_(?P<uid>[a-f0-9\-]+)\/(?P<container_name>[^\._]+)\/(?P<restart_count>\d+)\.log$
type: regex_parser
接下來就是通過 move 操作符將一個字段從一個位置移動(或重命名)到另一個位置。
- from: attributes.stream
  to: attributes["log.iostream"]
  type: move
- from: attributes.container_name
  to: resource["k8s.container.name"]
  type: move
- from: attributes.namespace
  to: resource["k8s.namespace.name"]
  type: move
- from: attributes.pod_name
  to: resource["k8s.pod.name"]
  type: move
- from: attributes.restart_count
  to: resource["k8s.container.restart_count"]
  type: move
- from: attributes.uid
  to: resource["k8s.pod.uid"]
  type: move
- from: attributes.log
  to: body
  type: move
最后我們可以將 Loki 數據源添加到 Grafana 中:
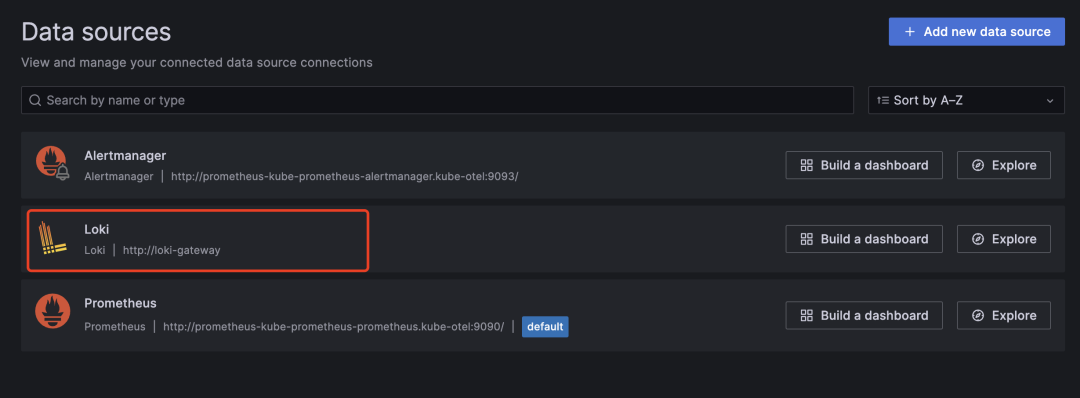
Loki 數據源
然后在 Explorer 頁面切換到 Loki 數據源下面就可以看到 Loki 中的日志數據了:
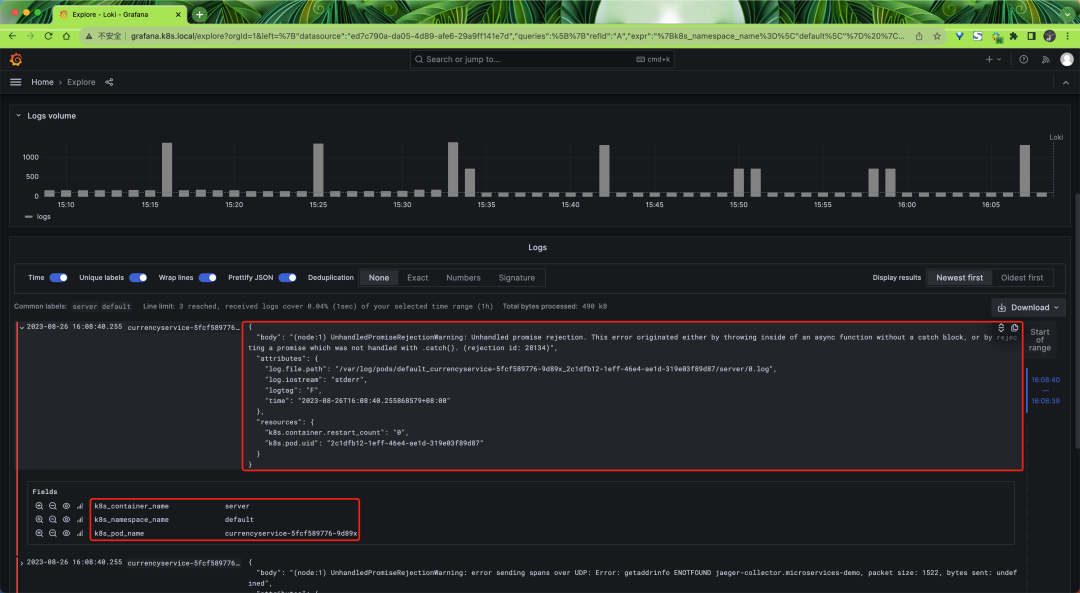
Loki 日志
啟用 k8sobject 接收器
同樣對于 Gateway 模式的采集器我們還可以去開啟 k8sobject 接收器來采集 Kubernetes Events 數據,然后更新 otel-collector-deploy-values.yaml 文件:
# otel-collector-deploy-values.yaml
mode: deployment

# 我們只需要一個收集器 - 多了就會產生重復數據
replicaCount: 1

presets:
  clusterMetrics:
    enabled: true
  kubernetesEvents:
    enabled: true

config:
  exporters:
    loki:
      endpoint: http://loki-gateway/loki/api/v1/push
      timeout: 10s # 超時時間
      read_buffer_size: 200
      write_buffer_size: 100
      retry_on_failure: # 配置重試
        enabled: true
        initial_interval: 10s # 初始間隔
        max_interval: 60s # 最大間隔
        max_elapsed_time: 10m # 最大時間

  service:
    pipelines:
      logs:
        exporters:
          - loki
然后重新更新 OpenTelemetry Collector Deployment:
$ helm upgrade --install opentelemetry-collector-cluster ./opentelemetry-collector -f otel-collector-deploy-values.yaml --namespace kube-otel --create-namespace這里我們開啟了 kubernetesEvents 預設,對應的配置如下所示:
k8sobjects:
objects:
- group: events.k8s.io
mode: watch
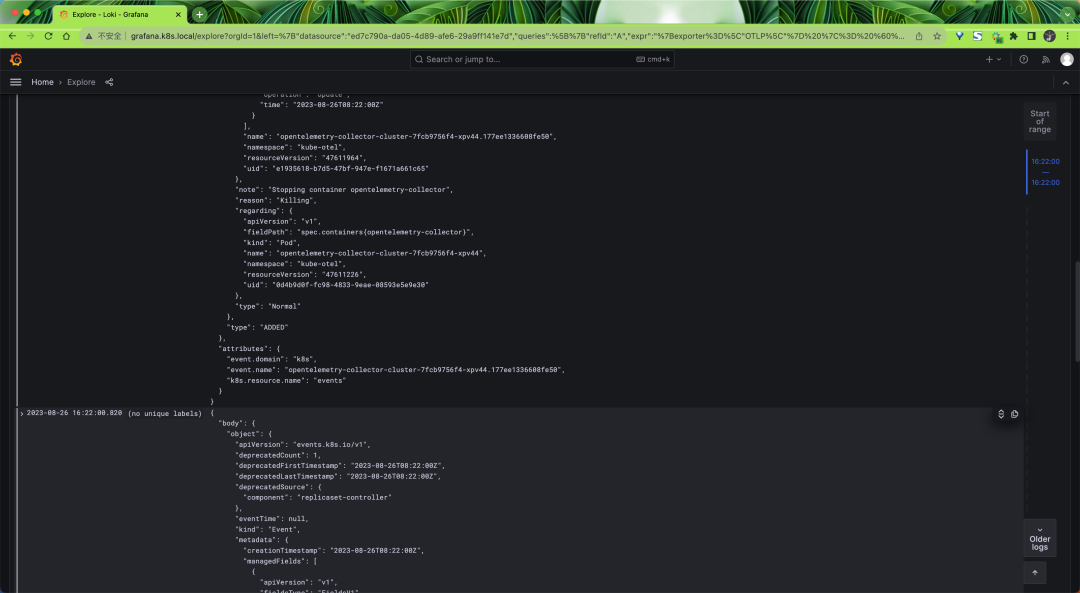
name: eventsk8sobjects 接收器可以用來拉取或 Watch Kubernetes API 服務器中的對象,我們這里通過 group、mode、name 來指定要拉取的 Kubernetes Events 對象。
最后我們也可以在 Loki 中查找到對應的 Events 日志數據。