實(shí)用|從0到1 搭建Web性能監(jiān)控系統(tǒng)
工具介紹
1. Statsd 是一個(gè)使用Node開發(fā)網(wǎng)絡(luò)守護(hù)進(jìn)程,它的特點(diǎn)是通過UDP(性能好,及時(shí)掛了也不影響主服務(wù))或者TCP來監(jiān)聽各種數(shù)據(jù)信息,然后發(fā)送聚合數(shù)據(jù)到后端服務(wù)進(jìn)行處理。常見支持的「Graphite」,「ElasticaSearch」,「InfluxDB」 等等 ,它集成了各種語言的客戶端API,這里我們使用了jsocol/pystatsd: A Python client for statsd進(jìn)行數(shù)據(jù)收集。
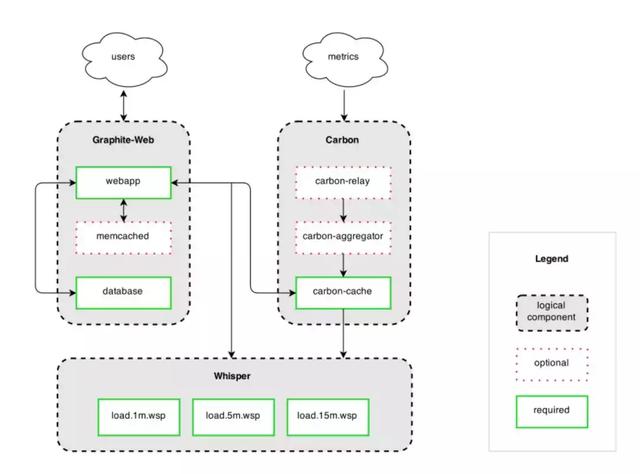
2. Graphite 是一套Python寫的開源編程接口,主要是用來收集服務(wù)器的及時(shí)狀態(tài),在這里主要作為statsd的數(shù)據(jù)后端。分為了三個(gè)子項(xiàng)目
- carbon 守護(hù)進(jìn)程,接收StatsD發(fā)送過來的原始統(tǒng)計(jì)數(shù)據(jù)。
- whisper 用來存儲(chǔ)統(tǒng)計(jì)數(shù)據(jù)的時(shí)間序列數(shù)據(jù)庫。
- graphite webapp 用來圖形化展示統(tǒng)計(jì)數(shù)據(jù)的web項(xiàng)目
3. Grafana 使用Go開發(fā),可以在界面上設(shè)計(jì)調(diào)整自己的統(tǒng)計(jì)圖表,支持多重報(bào)警,可定制化。
安裝
在這里我使用了[synthesize(https://github.com/obfuscurity/synthesize)進(jìn)行快速安裝Graphite和Statsd包,這里面需要注意安裝數(shù)據(jù)在 **/opt/graphite ** 目錄下面。這里面我們安裝啟動(dòng)了
- service carbon-cache start # statsd數(shù)據(jù)處理后會(huì)進(jìn)入中轉(zhuǎn)
- service memcached start # 緩存
- service collectd start # 收集服務(wù)負(fù)載可選
- service apache2 start # 這可以通過使用nginx替換
- service statsite start # statsd的后端服務(wù)
這里面需要單獨(dú)啟動(dòng)graphite-web應(yīng)用,端口啟動(dòng):0.0.0.0:8080,后面配置數(shù)據(jù)源需要使用。
- cd /opt/graphite/
- sudo ./run-graphite-devel-server.py /opt/graphite/
Grafana數(shù)據(jù)包可以通過手動(dòng)下載安裝也可以通過apt-get 安裝
- sudo apt-get install grafana
啟動(dòng)之后訪問3000端口就能看到這樣一個(gè)頁面,默認(rèn)的賬號(hào)密碼:admin,admin可以通過配置github或者google登錄。
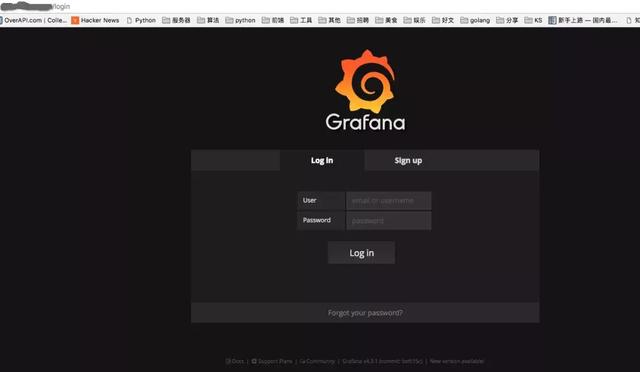
login
數(shù)據(jù)收集
Python端我們使用statsd進(jìn)行數(shù)據(jù)統(tǒng)一打點(diǎn)到到監(jiān)控服務(wù)器收集
- >>> import statsd
- >>> c = statsd.StatsClient('localhost', 8125)
- >>> c.incr('foo') # Increment the 'foo' counter.
- >>> c.timing('stats.timed', 320) # Record a 320ms 'stats.timed'.
- 這里面我們通過Python把數(shù)據(jù)收集到statsite,通過Graphite Web服務(wù)來進(jìn)行展示。
配置Graphite
進(jìn)入Grafana后臺(tái),進(jìn)行配置點(diǎn)擊 「Data Sources」進(jìn)行配置Graphite的數(shù)據(jù)(來自前端statsd收集)。
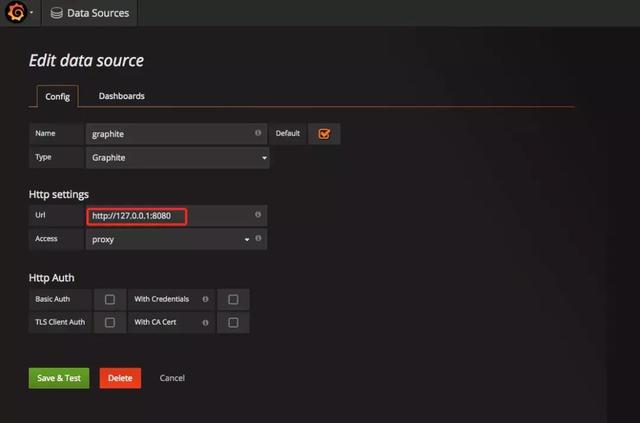
data_source
接下來配置對(duì)應(yīng)的數(shù)據(jù)展示:
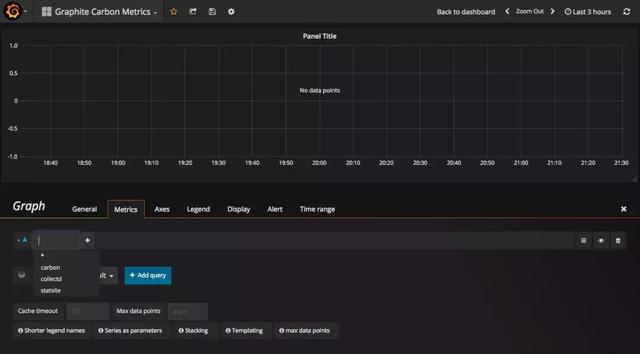
add-graph
到此基本的數(shù)據(jù)配置就完了,恭喜你擁有了一個(gè)完整的監(jiān)控系統(tǒng)。
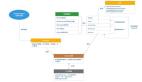
為了方便理解這里我補(bǔ)充一下,數(shù)據(jù)從應(yīng)用內(nèi),添加agent,把應(yīng)用的時(shí)間性能數(shù)據(jù)通過statsd收集發(fā)送到服務(wù)端,通過carbon統(tǒng)計(jì),whisper存儲(chǔ)最后展示在graphite,其中這里面我們用grafana來替代了graphite原生的UI展示,也就是我們題圖的效果。