手把手教你實現Prometheus通過企業微信告警

1、prometheus架構
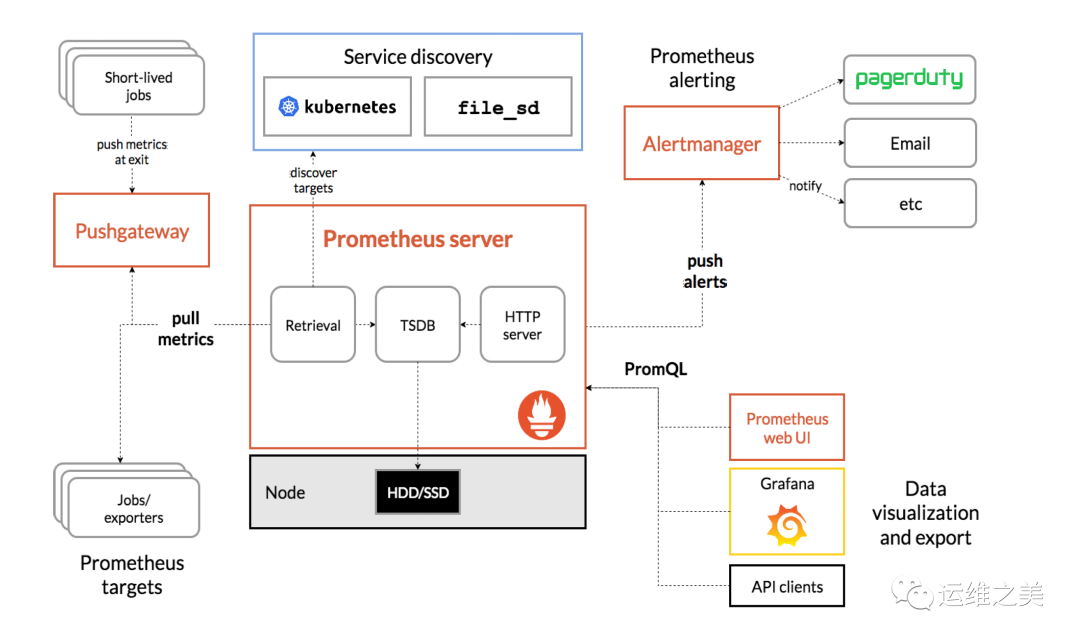
組件介紹
- Prometheus Server:收集指標和存儲時間序列數據,并提供查詢接口
PushGateway:短期存儲指標數據。主要用于臨時性的任務 - Exporters:是提供監控數據的來源,采集已有的第三方服務監控指標并暴露metrics,常見的監控主機安裝node-exporter,數據庫mysql-exporter,按需安裝,對于Exporter,Prometheus Server采用pull的方式來采集數據
- Alertmanager:告警觸發并通過短信,郵件等將告警發送出來
- Web UI:簡單的Web控制臺,可以通過安裝grafana,并配置prometheus數據源來做監控大盤
前置準備工作,提前部署好Prometheus,grafana,node-exporter,此處不做詳細講解
### 部署 Prometheus
docker run -d --name=prometheus -p 9090:9090 prom/prometheus
#可以將配置文件
訪問地址:http://IP:9090
### 部署 Grafana
docker run -d --name=grafana -p 3000:3000 grafana/grafana
訪問地址:http://IP:3000
### 部署node-exporter ###
wget https://github.com/prometheus/node_exporter/releases/download/v1.0.1/node_exporter-1.0.1.linux-amd64.tar.gz
tar xvfz node_exporter-*.*-amd64.tar.gz
cd node_exporter-*.*-amd64
./node_exporter
2、前置準備工作
環境:prometheus服務端和alertmanager部署在同一臺機器上,實驗前提是prometheus服務端已經安裝好
操作系統:Centos7.4
prometheus的告警管理分為兩部分。通過在prometheus服務端設置告警規則, Prometheus服務器端通過拉取exporter的數據指標,當指標滿足告警閾值后,通過Alertmanager管理這些告警,包括靜默,抑制,聚合以及通過電子郵件,企業微信,釘釘等方法發送告警通知。
設置警報和通知的主要步驟如下:
- 部署prometheus,一臺機器【本文略】
- node-exporter,所有要監控節點都要部署,類似于agent【本文略】
- 安裝啟動Alertmanager,和prometheus同節點
- 配置Prometheus對Alertmanager訪問,配置告警規則;
- 配置企微后臺,alertmanager配置對接企微并配置告警模板;
- 修改閾值觸發告警
前置工作,也可以采用離線包方式部署
### 部署 Prometheus
#創建prometheus的docker-compose.yml的配置
services:
  prometheus:
    command:
    - --web.listen-address=0.0.0.0:9090
    - --config.file=/etc/prometheus/prometheus.yml
    - --storage.tsdb.path=/var/lib/prometheus
    - --storage.tsdb.retention.time=30d
    - --web.enable-lifecycle
    - --web.external-url=prometheus
    - --web.enable-admin-api
    container_name: prometheus
    deploy:
      resources:
        limits:
          cpus: '2'
          memory: 8g
    hostname: prometheus
    image: prom/prometheus
    labels:
    - docker-compose-reset=true
    - midware-group=monitor
    network_mode: host
    restart: always
    volumes:
    - /usr/share/zoneinfo/Hongkong:/etc/localtime
    - /data/prometheus/data:/var/lib/prometheus
    - /data/prometheus/config:/etc/prometheus
    working_dir: /var/lib/prometheus
version: '3'
#執行docker-compose up -d啟動prometheus服務
### 部署 Grafana
docker run -d --name=grafana -p 3000:3000 grafana/grafana
訪問地址:http://IP:3000
### 部署node-exporter ###
wget https://github.com/prometheus/node_exporter/releases/download/v1.0.1/node_exporter-1.0.1.linux-amd64.tar.gz
tar xvfz node_exporter-*.*-amd64.tar.gz
cd node_exporter-*.*-amd64
./node_exporter
3、安裝AlertManager
以官網最新版本為例,可以從官網地址下載alertmanager安裝包https://prometheus.io/download/
將包上傳到服務器上,按照下面步驟安裝和啟動alertmanager服務
[root@localhost ~]# mkdir -p /data/alertmanager
[root@localhost~]# tar -xvf alertmanager-0.22.2.linux-amd64.tar.gz  -C /data/alertmanager
[root@localhost~]# cd /data/alertmanager/
[root@localhost alertmanager]# nohup ./alertmanager &
4、配置prometheus告警規則
prometheus中添加配置監控alertmanager服務器
prometheus.yml添加如下配置
alerting:
  alertmanagers:
  - static_configs:
    - targets:
      - 192.168.61.123:9093
rule_files:
  - "rules/*_rules.yml"
  - "rules/*_alerts.yml"
scrape_configs:
  - job_name: 'alertmanager' #配置alertmanager,等alertmanager部署后配置
    static_configs:
    - targets: ['localhost:9093']
  - job_name: 'node_exporter'   #配置node-exporter
    static_configs:
    - targets: ['192.168.61.123:9100']
rule_files為告警觸發的規則文件
prometheus當前路徑下新建rules目錄,創建如下配置文件,分別配置節點告警和pod容器告警
[root@prometheus prometheus]# cd rules/
[root@prometheus rules]# ls
node_alerts.yml pod_rules.yml- Node節點告警
node_alerts.yml #監控主機級別告警
[root@localhost rules]# cat node_alerts.yml
groups:
- name: 主機狀態-監控告警
  rules:
  - alert: 主機狀態
    expr: up {job="kubernetes-nodes"} == 0
    for: 15s
    labels:
      status: 非常嚴重
    annotations:
      summary: "{{.instance}}:服務器宕機"
      description: "{{.instance}}:服務器延時超過15s"
  - alert: CPU使用情況
    expr: 100-(avg(irate(node_cpu_seconds_total{mode="idle"}[5m])) by(instance)* 100) > 60
    for: 1m
    labels:
      status: warning
    annotations:
      summary: "{{$labels.instance}}: High CPU Usage Detected"
      description: "{{$labels.instance}}: CPU usage is {{$value}}, above 60%"

  - alert: NodeFilesystemUsage
    expr: 100 - (node_filesystem_free_bytes{fstype=~"ext4|xfs"} / node_filesystem_size_bytes{fstype=~"ext4|xfs"} * 100) > 80
    for: 1m
    labels:
      severity: warning
    annotations:
      summary: "Instance {{ $labels.instance }} : {{ $labels.mountpoint }} 分區使用率過高"
      description: "{{ $labels.instance }}: {{ $labels.mountpoint }} 分區使用大于80% (當前值: {{ $value }})"
  - alert: 內存使用
    expr: (node_memory_MemTotal_bytes - node_memory_MemAvailable_bytes) / node_memory_MemTotal_bytes * 100 > 80
    for: 1m
    labels:
      status: 嚴重告警
    annotations:
      summary: "{{ $labels.instance}} 內存使用率過高!"
      description: "{{ $labels.instance }} 內存使用大于80%(目前使用:{{ $value}}%)"
  - alert: IO性能
    expr: (avg(irate(node_disk_io_time_seconds_total[1m])) by(instance)* 100) > 60
    for: 1m
    labels:
      status: 嚴重告警
    annotations:
      summary: "{{$labels.instance}} 流入磁盤IO使用率過高!"
description: "{{ $labels.instance }} 流入磁盤IO大于60%(目前使用:{{ $value }})"- pod告警配置
pod_rules.yml文件配置 #pod級別告警
[root@localhost rules]# cat pod_rules.yml
groups:
- name: k8s_pod.rules
  rules:
  - alert: pod-status
    expr: kube_pod_container_status_running != 1
    for: 5s
    labels:
      severity: warning
    annotations:
      description : pod-{{ $labels.pod }}故障
      summary: pod重啟告警
  - alert: Pod_all_cpu_usage
    expr: (sum by(name)(rate(container_cpu_usage_seconds_total{image!=""}[5m]))*100) > 10
    for: 5m
    labels:
      severity: critical
      service: pods
    annotations:
      description: 容器 {{ $labels.name }} CPU 資源利用率大于 75% , (current value is {{ $value }})
      summary: Dev CPU 負載告警
  - alert: Pod_all_memory_usage
    expr: sort_desc(avg by(name)(irate(container_memory_usage_bytes{name!=""}[5m]))*100) > 1024*10^3*2
    for: 10m
    labels:
      severity: critical
    annotations:
      description: 容器 {{ $labels.name }} Memory 資源利用率大于 2G , (current value is {{ $value }})
      summary: Dev Memory 負載告警
  - alert: Pod_all_network_receive_usage
    expr: sum by (name)(irate(container_network_receive_bytes_total{container_name="POD"}[1m])) > 1024*1024*50
    for: 10m
    labels:
      severity: critical
    annotations:
      description: 容器 {{ $labels.name }} network_receive 資源利用率大于 50M , (current value is {{ $value }})
summary: network_receive 負載告警更多告警規則【科學上網】
https://samber.github.io/awesome-prometheus-alerts/rules
for子句:Prometheus將expr中的規則作為觸發條件, 在這種情況下,Prometheus將在每次檢查警報是否繼續處于活動狀態,然后再觸發警報。處于活動狀態但尚未觸發的元素處于pending狀態,for中定義時間即為達到活動狀態持續時間才觸發告警
配置加之后熱重啟prometheus服務
curl -XPOST http://localhost:9090/-/reload注:prometheus啟動命令添加參數--web.enable-lifecycle可實現支持熱重啟
$ ./promtool check config prometheus.yml
Checking prometheus.yml
  SUCCESS: 0 rule files found
上面命令可以檢查配置文件修改是否正確
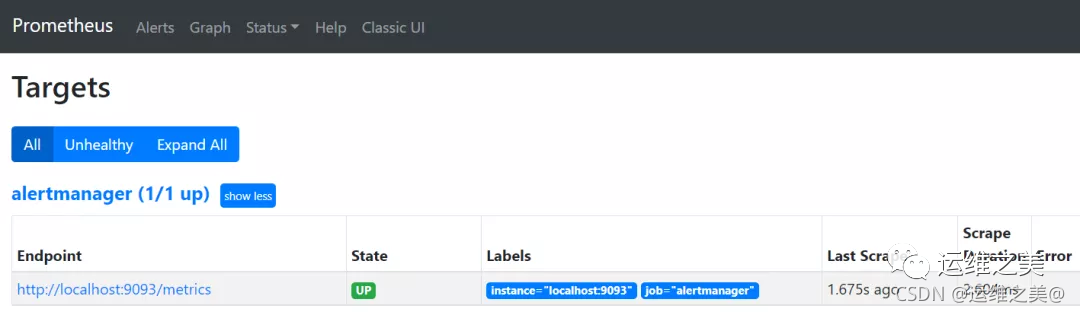
登錄prometheus targets界面已經出現alertmanager的監控對象
檢查prometheus告警規則配置是否生效
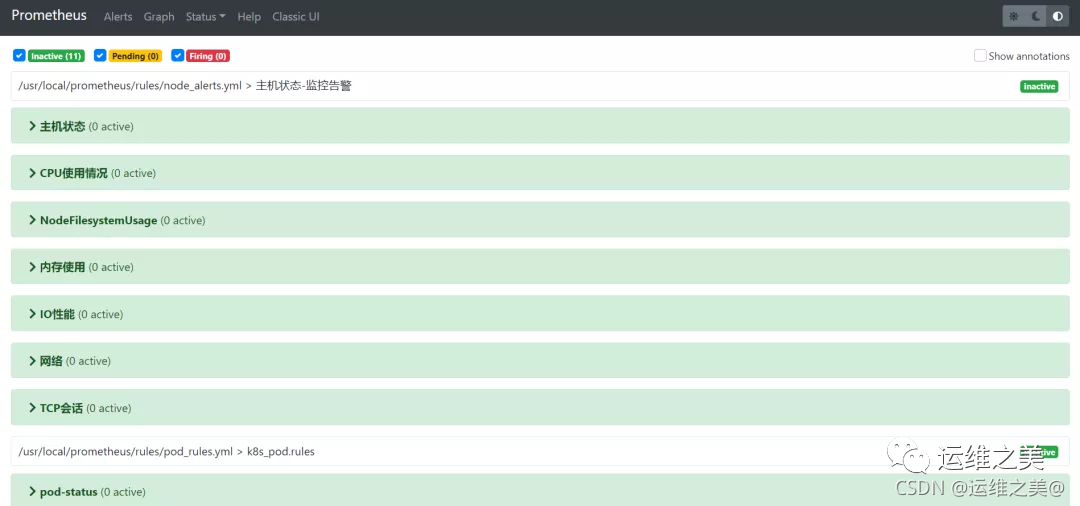
可以看到node和pod的監控指標都已經加載,Perfect,離成功更近一步
5、配置AlertManager告警發送
實現企業微信告警通知,需要首先在企業后臺創建應用,起名叫prometheus

記錄企業ID,secret,agentid信息,后邊配置文件中需要。
[root@localhost alertmanager]# cat alertmanager.yml
global:
  resolve_timeout: 1m   # 每1分鐘檢測一次是否恢復
  wechat_api_url: 'https://qyapi.weixin.qq.com/cgi-bin/'
  wechat_api_corp_id: 'xxxxxxxxx'      # 企業微信中企業ID
  wechat_api_secret: 'xxxxxxxx'
templates:
  - '/data/alertmanager/template/*.tmpl'
route:
  receiver: 'wechat'
  group_by: ['env','instance','type','group','job','alertname']
  group_wait: 10s
  group_interval: 5s
  repeat_interval: 1h

receivers:
- name: 'wechat'
  wechat_configs:
  - send_resolved: true
    message: '{{ template "wechat.default.message" . }}'
    to_party: '57'
    agent_id: 'xxxx'   #企微后臺查詢的agentid
    to_user : "@all"
    api_secret: 'xxxxxxx'  #后臺查詢的secret
說明
- wechat_api_url配置為企業微信的接口地址,因此需要alertmanager所在服務器能夠連接公網
- to_user需要配置,all是發送所有可見范圍用戶,無此標簽告警無法發出,本人親測,企微后臺可見范圍可以添加接收告警的用戶
- 字段解釋
- global:全局配置
- resolve_timeout:告警恢復超時時間,當接收的告警沒有EndsAt字段時,經過該時間就將該告警標志為已解決,prometheus上用不上,告警都會帶EndsAt字段
- route:告警分配配置
- group_by:設置分組標簽,告警時出現的labels都可用于分組,如果需要對所有不同label都分組,可以使用’…’
- group_wait:告警發送等待時間,時間拉長便于告警聚合
- group_interval:前后兩組告警發送間隔時間
- repeat_interval:重復告警發送間隔時間
- receiver:定義接收告警的對象
- receivers:告警接收對象,這部分信息參考步驟1獲取
- name:告警接收名稱,與route中的receiver一一對應,這里我們配置的是企業微信
- corp_id: 企業微信唯一ID,我的企業 -> 企業信息
- to_party: 告警需要發送的組
- agent_id: 自己創建應用的ID,自己創建的應用詳情頁面查看
- api_secret: 自己創建應用的密鑰,自己創建的應用詳情頁面查看
- send_resolved: 告警解決是否發送通知
- inhibit_rules:告警抑制規則
當新的告警匹配到target_match規則,而已發送告警滿足source_match規則,并且新告警與已發送告警中equal定義的標簽完全相同,則抑制這個新的告警。
上述配置的結果就是同個instance的同個alertname告警,major會抑制warning告警,這很好理解,比如閾值告警,達到critical肯定也達到了warning,沒必要發送兩個告警。
不過,從實際測試結果看,這個抑制規則只能在觸發告警時使用,對于告警恢復沒有,應該是個bug,也有可能我用的版本過低,有時間再去看下源碼,查一查
templates:告警消息模板
企業微信告警發送模板,當前路徑新建template目錄
[root@localhost alertmanager]# cat template/wechat.tmpl
{{ define "wechat.default.message" }}
{{- if gt (len .Alerts.Firing) 0 -}}
{{- range $index, $alert := .Alerts -}}
{{- if eq $index 0 }}
=========xxx環境監控報警 =========
告警狀態:{{ .Status }}
告警級別:{{ .Labels.severity }}
告警類型:{{ $alert.Labels.alertname }}
故障主機: {{ $alert.Labels.instance }} {{ $alert.Labels.pod }}
告警主題: {{ $alert.Annotations.summary }}
告警詳情: {{ $alert.Annotations.message }}{{ $alert.Annotations.description}};
觸發閥值:{{ .Annotations.value }}
故障時間: {{ ($alert.StartsAt.Add 28800e9).Format "2006-01-02 15:04:05" }}
========= = end = =========
{{- end }}
{{- end }}
{{- end }}
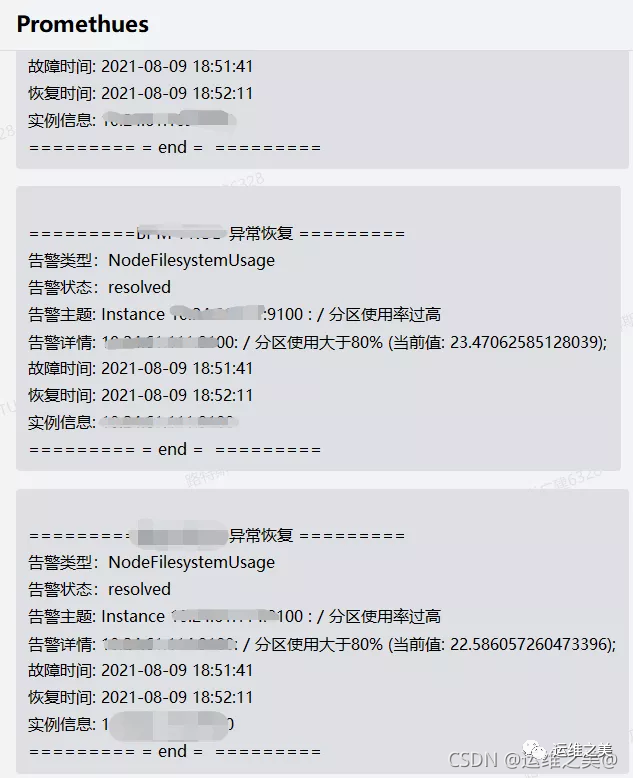
{{- if gt (len .Alerts.Resolved) 0 -}}
{{- range $index, $alert := .Alerts -}}
{{- if eq $index 0 }}
=========xxx環境異常恢復 =========
告警類型:{{ .Labels.alertname }}
告警狀態:{{ .Status }}
告警主題: {{ $alert.Annotations.summary }}
告警詳情: {{ $alert.Annotations.message }}{{ $alert.Annotations.description}};
故障時間: {{ ($alert.StartsAt.Add 28800e9).Format "2006-01-02 15:04:05" }}
恢復時間: {{ ($alert.EndsAt.Add 28800e9).Format "2006-01-02 15:04:05" }}
{{- if gt (len $alert.Labels.instance) 0 }}
實例信息: {{ $alert.Labels.instance }}
{{- end }}
========= = end = =========
{{- end }}
{{- end }}
{{- end }}
{{- end }}配置修改后,執行命令進行熱重啟
curl -XPOST http://localhost:9093/-/reload配置完成,我們可以調整告警閾值進行測試
修改/usr/local/prometheus/rules/node_alerts.yml中磁盤告警閾值
expr: 100 - (node_filesystem_free_bytes{fstype=~"ext4|xfs"} / node_filesystem_size_bytes{fstype=~"ext4|xfs"} * 100) > 10修改為>10就告警,登錄管理界面發現馬上就收到告警了
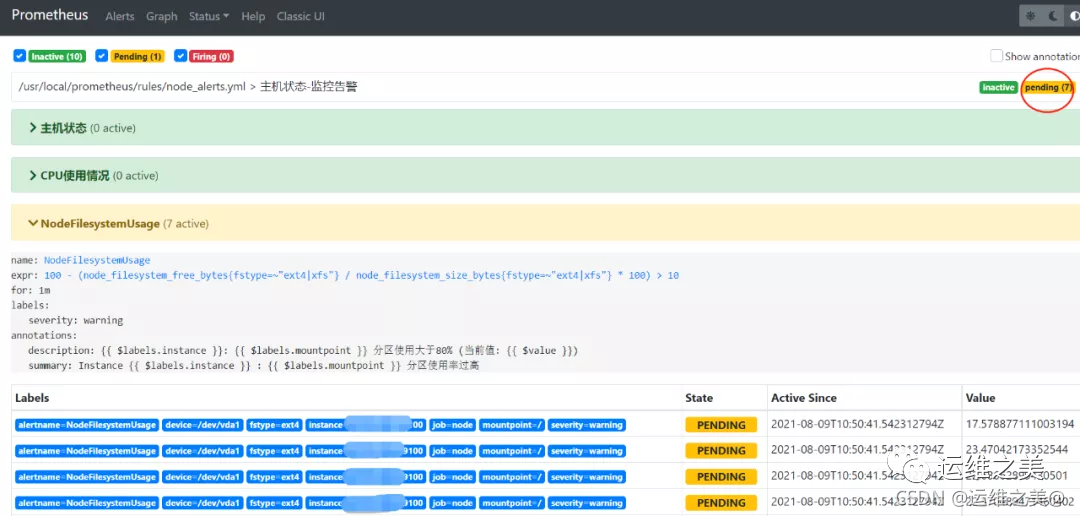
這里說明一下 Prometheus Alert 告警狀態有三種狀態:Inactive、Pending、Firing。
- Inactive:非活動狀態,表示正在監控,但是還未有任何警報觸發。
- Pending:表示這個警報必須被觸發。由于警報可以被分組、壓抑/抑制或靜默/靜音,所以等待驗證,一旦所有的驗證都通過,則將轉到 Firing 狀態。
- Firing:將警報發送到 AlertManager,它將按照配置將警報的發送給所有接收者。一旦警報解除,則將狀態轉到 Inactive,如此循環。
大功告成,此處該有掌聲!