通過(guò)Exporter收集一切指標(biāo)
本文轉(zhuǎn)載自微信公眾號(hào)「運(yùn)維開(kāi)發(fā)故事」,作者沒(méi)有文案的夏老師。轉(zhuǎn)載本文請(qǐng)聯(lián)系運(yùn)維開(kāi)發(fā)故事公眾號(hào)。
Exporter介紹
Exporter 是一個(gè)采集監(jiān)控?cái)?shù)據(jù)并通過(guò) Prometheus 監(jiān)控規(guī)范對(duì)外提供數(shù)據(jù)的組件,它負(fù)責(zé)從目標(biāo)系統(tǒng)(Your 服務(wù))搜集數(shù)據(jù),并將其轉(zhuǎn)化為 Prometheus 支持的格式。Prometheus 會(huì)周期性地調(diào)用 Exporter 提供的 metrics 數(shù)據(jù)接口來(lái)獲取數(shù)據(jù)。那么使用 Exporter 的好處是什么?舉例來(lái)說(shuō),如果要監(jiān)控 Mysql/Redis 等數(shù)據(jù)庫(kù),我們必須要調(diào)用它們的接口來(lái)獲取信息(前提要有),這樣每家都有一套接口,這樣非常不通用。所以 Prometheus 做法是每個(gè)軟件做一個(gè) Exporter,Prometheus 的 Http 讀取 Exporter 的信息(將監(jiān)控指標(biāo)進(jìn)行統(tǒng)一的格式化并暴露出來(lái))。簡(jiǎn)單類比,Exporter 就是個(gè)翻譯,把各種語(yǔ)言翻譯成一種統(tǒng)一的語(yǔ)言。
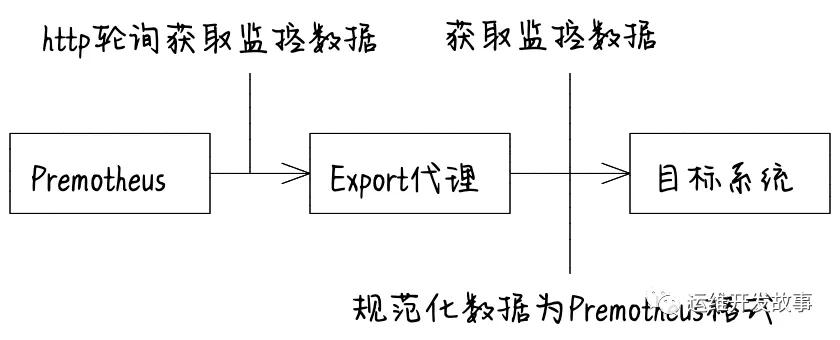
對(duì)于Exporter而言,它的功能主要就是將數(shù)據(jù)周期性地從監(jiān)控對(duì)象中取出來(lái)進(jìn)行加工,然后將數(shù)據(jù)規(guī)范化后通過(guò)端點(diǎn)暴露給Prometheus,所以主要包含如下3個(gè)功能。
- 封裝功能模塊獲取監(jiān)控系統(tǒng)內(nèi)部的統(tǒng)計(jì)信息。
- 將返回?cái)?shù)據(jù)進(jìn)行規(guī)范化映射,使其成為符合Prometheus要求的格式化數(shù)據(jù)。
- Collect模塊負(fù)責(zé)存儲(chǔ)規(guī)范化后的數(shù)據(jù),最后當(dāng)Prometheus定時(shí)從Exporter提取數(shù)據(jù)時(shí),Exporter就將Collector收集的數(shù)據(jù)通過(guò)HTTP的形式在/metrics端點(diǎn)進(jìn)行暴露。
介紹Primetheus client
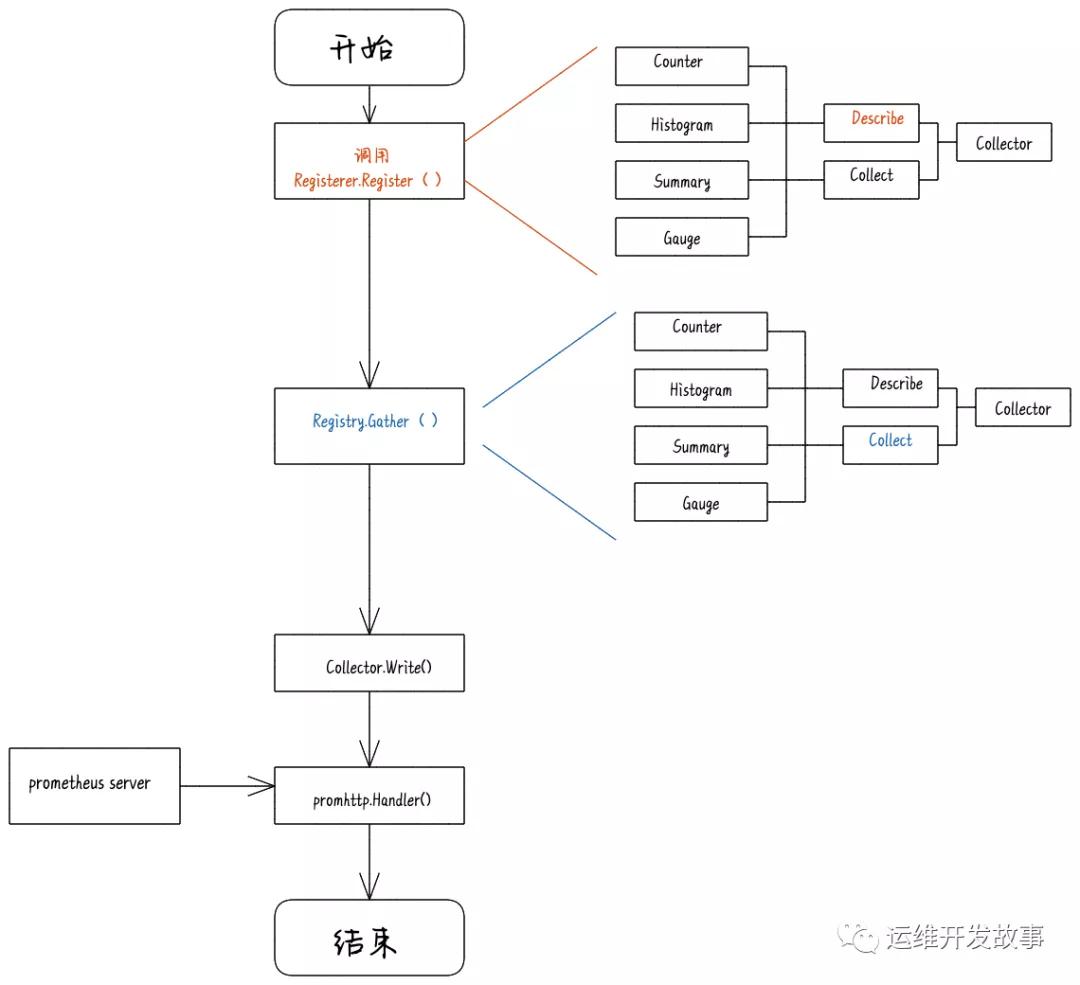
本文將介紹Primetheus client的使用,基于golang語(yǔ)言,golang client 是當(dāng)pro收集所監(jiān)控的系統(tǒng)的數(shù)據(jù)時(shí),用于響應(yīng)pro的請(qǐng)求,按照一定的格式給pro返回?cái)?shù)據(jù),說(shuō)白了就是一個(gè)http server, 源碼參見(jiàn)github,相關(guān)的文檔參見(jiàn)GoDoc,讀者可以直接閱讀文檔進(jìn)行開(kāi)發(fā),本文只是幫助理解。以下是簡(jiǎn)化流程圖:
四種數(shù)據(jù)類型
prometheus將所有數(shù)據(jù)保存為timeseries data,用metric name和label區(qū)分,label是在metric name上的更細(xì)維度的劃分,其中的每一個(gè)實(shí)例是由一個(gè)float64和timestamp組成,只不過(guò)timestamp是隱式加上去的,有時(shí)候不會(huì)顯示出來(lái)。如下面所示(數(shù)據(jù)來(lái)源于prometheus暴露的監(jiān)控?cái)?shù)據(jù),訪問(wèn)http://localhost:9090/metrics 可得),其中g(shù)o_gc_duration_seconds是metrics name,quantile="0.5"是key-value pair的label,而后面的值是float64 value。
- # HELP go_gc_duration_seconds A summary of the GC invocation durations.
- # TYPE go_gc_duration_seconds summary
- go_gc_duration_seconds{quantile="0.5"} 0.000107458
- go_gc_duration_seconds{quantile="0.75"} 0.000200112
- go_gc_duration_seconds{quantile="1"} 0.000299278
- go_gc_duration_seconds_sum 0.002341738
- go_gc_duration_seconds_count 18
- # HELP go_goroutines Number of goroutines that currently exist.
- # TYPE go_goroutines gauge
- go_goroutines 107
這些信息有一個(gè)共同點(diǎn),就是采用了不同于JSON或者Protocol Buffers的數(shù)據(jù)組織形式——文本形式。在文本形式中,每個(gè)指標(biāo)都占用一行,#HELP代表指標(biāo)的注釋信息,#TYPE用于定義樣本的類型注釋信息,緊隨其后的語(yǔ)句就是具體的監(jiān)控指標(biāo)(即樣本)。#HELP的內(nèi)容格式如下所示,需要填入指標(biāo)名稱及相應(yīng)的說(shuō)明信息。
- HELP <metrics_name> <doc_string>
#TYPE的內(nèi)容格式如下所示,需要填入指標(biāo)名稱和指標(biāo)類型(如果沒(méi)有明確的指標(biāo)類型,需要返回untyped)。
- TYPE <metrics_name> <metrics_type>
監(jiān)控樣本部分需要滿足如下格式規(guī)范。
- metric_name [ "{" label_name "=" " label_value " { "," label_name "=" " label_value " } [ "," ] "}" ] value [ timestamp ]
其中,metric_name和label_name必須遵循PromQL的格式規(guī)范。value是一個(gè)f loat格式的數(shù)據(jù),timestamp的類型為int64(從1970-01-01 00:00:00開(kāi)始至今的總毫秒數(shù)),可設(shè)置其默認(rèn)為當(dāng)前時(shí)間。具有相同metric_name的樣本必須按照一個(gè)組的形式排列,并且每一行必須是唯一的指標(biāo)名稱和標(biāo)簽鍵值對(duì)組合。Prometheus為了方便client library的使用提供了四種數(shù)據(jù)類型:
Counter:Counter是一個(gè)累加的數(shù)據(jù)類型。一個(gè)Counter類型的指標(biāo)只會(huì)隨著時(shí)間逐漸遞增(當(dāng)系統(tǒng)重啟的時(shí)候,Counter指標(biāo)會(huì)被重置為0)。記錄系統(tǒng)完成的總?cè)蝿?wù)數(shù)量、系統(tǒng)從最近一次啟動(dòng)到目前為止發(fā)生的總錯(cuò)誤數(shù)等場(chǎng)景都適合使用Counter類型的指標(biāo)。
- Gauge:Gauge指標(biāo)主要用于記錄一個(gè)瞬時(shí)值,這個(gè)指標(biāo)可以增加也可以減少,比如CPU的使用情況、內(nèi)存使用量以及硬盤當(dāng)前的空間容量等。
- Histogram:Histogram表示柱狀圖,主要用于統(tǒng)計(jì)一些數(shù)據(jù)分布的情況,可以計(jì)算在一定范圍內(nèi)的數(shù)據(jù)分布情況,同時(shí)還提供了指標(biāo)值的總和。在大多數(shù)情況下,用戶會(huì)使用某些指標(biāo)的平均值作為參考,例如,使用系統(tǒng)的平均響應(yīng)時(shí)間來(lái)衡量系統(tǒng)的響應(yīng)能力。這種方式有個(gè)明顯的問(wèn)題——如果大多數(shù)請(qǐng)求的響應(yīng)時(shí)間都維持在100ms內(nèi),而個(gè)別請(qǐng)求的響應(yīng)時(shí)間需要1s甚至更久,那么響應(yīng)時(shí)間的平均值體現(xiàn)不出響應(yīng)時(shí)間中的尖刺,這就是所謂的“長(zhǎng)尾問(wèn)題”。為了更加真實(shí)地反映系統(tǒng)響應(yīng)能力,常用的方式是按照請(qǐng)求延遲的范圍進(jìn)行分組,例如在上述示例中,可以分別統(tǒng)計(jì)響應(yīng)時(shí)間在[0,100ms]、[100,1s]和[1s,∞]這3個(gè)區(qū)間的請(qǐng)求數(shù),通過(guò)查看這3個(gè)分區(qū)中請(qǐng)求量的分布,就可以比較客觀地分析出系統(tǒng)的響應(yīng)能力。
- Summary:Summary與Histogram類似,也會(huì)統(tǒng)計(jì)指標(biāo)的總數(shù)(以_count作為后綴)以及sum值(以_sum作為后綴)。兩者的主要區(qū)別在于,Histogram指標(biāo)直接記錄了在不同區(qū)間內(nèi)樣本的個(gè)數(shù),而Summary類型則由客戶端計(jì)算對(duì)應(yīng)的分位數(shù)。例如下面展示了一個(gè)Summary類型的指標(biāo),其中quantile=”0.5”表示中位數(shù),quantile=”0.9”表示九分位數(shù)。
廣義上講,所有可以向Prometheus提供監(jiān)控樣本數(shù)據(jù)的程序都可以被稱為一個(gè)Exporter,Exporter的一個(gè)實(shí)例被稱為target,Prometheus會(huì)通過(guò)輪詢的形式定期從這些target中獲取樣本數(shù)據(jù)。
自己動(dòng)手編寫(xiě)一個(gè)Exporter
一般來(lái)說(shuō),絕大多數(shù)Exporter都是基于Go語(yǔ)言編寫(xiě)的,一小部分是基于Python語(yǔ)言編寫(xiě)的,還有很小一部分是使用Java語(yǔ)言編寫(xiě)的。比如官方提供的Consul Metrics自定義采集器Exporter,如果是在Go語(yǔ)言的運(yùn)行環(huán)境下,需要按照如下所示代碼運(yùn)行這個(gè)Exporter。
- package main
- import (
- "log"
- "net/http"
- "github.com/prometheus/client_golang/prometheus"
- "github.com/prometheus/client_golang/prometheus/promhttp"
- )
- var (
- cpuTemp = prometheus.NewGauge(prometheus.GaugeOpts{
- NameSpace: "our_idc",
- Subsystem: "k8s"
- Name: "cpu_temperature_celsius",
- Help: "Current temperature of the CPU.",
- })
- hdFailures = prometheus.NewCounterVec(
- prometheus.CounterOpts{
- NameSpace: "our_idc",
- Subsystem: "k8s"
- Name: "hd_errors_total",
- Help: "Number of hard-disk errors.",
- },
- []string{"device"},
- )
- )
- func init() {
- // Metrics have to be registered to be exposed:
- prometheus.MustRegister(cpuTemp)
- prometheus.MustRegister(hdFailures)
- }
- func main() {
- cpuTemp.Set(65.3)
- hdFailures.With(prometheus.Labels{"device":"/dev/sda"}).Inc()
- // The Handler function provides a default handler to expose metrics
- // via an HTTP server. "/metrics" is the usual endpoint for that.
- http.Handle("/metrics", promhttp.Handler())
- log.Fatal(http.ListenAndServe(":8888", nil))
其中創(chuàng)建了一個(gè)gauge和CounterVec對(duì)象,并分別指定了metric name和help信息,其中CounterVec是用來(lái)管理相同metric下不同label的一組Counter,同理存在GaugeVec,可以看到上面代碼中聲明了一個(gè)lable的key為“device”,使用的時(shí)候也需要指定一個(gè)lable: hdFailures.With(prometheus.Labels{"device":"/dev/sda"}).Inc()。變量定義后進(jìn)行注冊(cè),最后再開(kāi)啟一個(gè)http服務(wù)的8888端口就完成了整個(gè)程序,Prometheus采集數(shù)據(jù)是通過(guò)定期請(qǐng)求該服務(wù)http端口來(lái)實(shí)現(xiàn)的。啟動(dòng)程序之后可以在web瀏覽器里輸入http://localhost:8888/metrics 就可以得到client暴露的數(shù)據(jù),其中有片段顯示為:
- # HELP our_idc_k8s_cpu_temperature_celsius Current temperature of the CPU.
- # TYPE our_idc_k8s_cpu_temperature_celsius gauge
- our_idc_k8s_cpu_temperature_celsius 65.3
- # HELP our_idc_k8s_hd_errors_total Number of hard-disk errors.
- # TYPE our_idc_k8s_hd_errors_total counter
- our_idc_k8s_hd_errors_total{device="/dev/sda"} 1
上圖就是示例程序所暴露出來(lái)的數(shù)據(jù),并且可以看到counterVec是有l(wèi)abel的,而單純的gauage對(duì)象卻不用lable標(biāo)識(shí),這就是基本數(shù)據(jù)類型和對(duì)應(yīng)Vec版本的差別。此時(shí)再查看http://localhost:9090/graph 就會(huì)發(fā)現(xiàn)服務(wù)狀態(tài)已經(jīng)變?yōu)閁P了。上面的例子只是一個(gè)簡(jiǎn)單的demo,因?yàn)樵趐rometheus.yml配置文件中我們指定采集服務(wù)器信息的時(shí)間間隔為60s,每隔60s Prometheus會(huì)通過(guò)http請(qǐng)求一次自己暴露的數(shù)據(jù),而在代碼中我們只設(shè)置了一次gauge變量cupTemp的值,如果在60s的采樣間隔里將該值設(shè)置多次,前面的值就會(huì)被覆蓋,只有Prometheus采集數(shù)據(jù)那一刻的值能被看到,并且如果不再改變這個(gè)值,Prometheus就始終能看到這個(gè)恒定的變量,除非用戶顯式通過(guò)Delete函數(shù)刪除這個(gè)變量。使用Counter,Gauage等這些結(jié)構(gòu)比較簡(jiǎn)單,但是如果不再使用這些變量需要我們手動(dòng)刪,我們可以調(diào)用resetfunction來(lái)清除之前的metrics。
自定義Collector
直接使用Collector,go client Colletor只會(huì)在每次響應(yīng)Prometheus請(qǐng)求的時(shí)候才收集數(shù)據(jù)。需要每次顯式傳遞變量的值,否則就不會(huì)再維持該變量,在Prometheus也將看不到這個(gè)變量。Collector是一個(gè)接口,所有收集metrics數(shù)據(jù)的對(duì)象都需要實(shí)現(xiàn)這個(gè)接口,Counter和Gauage等不例外。它內(nèi)部提供了兩個(gè)函數(shù),Collector用于收集用戶數(shù)據(jù),將收集好的數(shù)據(jù)傳遞給傳入?yún)?shù)Channel就可;Descirbe函數(shù)用于描述這個(gè)Collector。
當(dāng)收集系統(tǒng)收集的數(shù)據(jù)太多時(shí)時(shí),就可以自定義Collector收集的方式,優(yōu)化流程,并且在某些情況下如果已經(jīng)有了一個(gè)成熟的metrics,就不需要使用Counter,Gauage等這些數(shù)據(jù)結(jié)構(gòu),直接在Collector內(nèi)部實(shí)現(xiàn)一個(gè)代理的功能即可。
基本上所有的export都是通過(guò)自定義Collector實(shí)現(xiàn)。一個(gè)簡(jiǎn)單的Collector的實(shí)現(xiàn)export的代碼如下:
- package main
- import (
- "github.com/prometheus/client_golang/prometheus"
- "github.com/prometheus/client_golang/prometheus/promhttp"
- "net/http"
- "sync"
- )
- type ClusterManager struct {
- sync.Mutex
- Zone string
- metricMapCounters map[string]string
- metricMapGauges map[string]string
- }
- //Simulate prepare the data
- func (c *ClusterManager) ReallyExpensiveAssessmentOfTheSystemState() (
- metrics map[string]float64,
- ) {
- metrics = map[string]float64{
- "oom_crashes_total": 42.00,
- "ram_usage": 6.023e23,
- }
- return
- }
- //通過(guò)NewClusterManager方法創(chuàng)建結(jié)構(gòu)體及對(duì)應(yīng)的指標(biāo)信息,代碼如下所示。
- // NewClusterManager creates the two Descs OOMCountDesc and RAMUsageDesc. Note
- // that the zone is set as a ConstLabel. (It's different in each instance of the
- // ClusterManager, but constant over the lifetime of an instance.) Then there is
- // a variable label "host", since we want to partition the collected metrics by
- // host. Since all Descs created in this way are consistent across instances,
- // with a guaranteed distinction by the "zone" label, we can register different
- // ClusterManager instances with the same registry.
- func NewClusterManager(zone string) *ClusterManager {
- return &ClusterManager{
- Zone: zone,
- metricMapGauges: map[string]string{
- "ram_usage": "ram_usage_bytes",
- },
- metricMapCounters: map[string]string{
- "oom_crashes": "oom_crashes_total",
- },
- }
- }
- //首先,采集器必須實(shí)現(xiàn)prometheus.Collector接口,也必須實(shí)現(xiàn)Describe和Collect方法。實(shí)現(xiàn)接口的代碼如下所示。
- // Describe simply sends the two Descs in the struct to the channel.
- // Prometheus的注冊(cè)器調(diào)用Collect來(lái)抓取參數(shù)
- // 將收集的數(shù)據(jù)傳遞到Channel中并返回
- // 收集的指標(biāo)信息來(lái)自Describe,可以并發(fā)地執(zhí)行抓取工作,但是必須要保證線程的安全
- func (c *ClusterManager) Describe(ch chan<- *prometheus.Desc) {
- // prometheus.NewDesc(prometheus.BuildFQName(namespace, "", metricName), docString, labels, nil)
- for _, v := range c.metricMapGauges {
- ch <- prometheus.NewDesc(prometheus.BuildFQName(c.Zone, "", v), v, nil, nil)
- }
- for _, v := range c.metricMapCounters {
- ch <- prometheus.NewDesc(prometheus.BuildFQName(c.Zone, "", v), v, nil, nil)
- }
- }
- //Collect方法是核心,它會(huì)抓取你需要的所有數(shù)據(jù),根據(jù)需求對(duì)其進(jìn)行分析,然后將指標(biāo)發(fā)送回客戶端庫(kù)。
- // 用于傳遞所有可能指標(biāo)的定義描述符
- // 可以在程序運(yùn)行期間添加新的描述,收集新的指標(biāo)信息
- // 重復(fù)的描述符將被忽略。兩個(gè)不同的Collector不要設(shè)置相同的描述符
- func (c *ClusterManager) Collect(ch chan<- prometheus.Metric) {
- c.Lock()
- defer c.Unlock()
- m := c.ReallyExpensiveAssessmentOfTheSystemState()
- for k, v := range m {
- t := prometheus.GaugeValue
- if c.metricMapCounters[k] != "" {
- t = prometheus.CounterValue
- }
- c.registerConstMetric(ch, k, v, t)
- }
- }
- // 用于傳遞所有可能指標(biāo)的定義描述符給指標(biāo)
- func (c *ClusterManager) registerConstMetric(ch chan<- prometheus.Metric, metric string, val float64, valType prometheus.ValueType, labelValues ...string) {
- descr := prometheus.NewDesc(prometheus.BuildFQName(c.Zone, "", metric), metric, nil, nil)
- if m, err := prometheus.NewConstMetric(descr, valType, val, labelValues...); err == nil {
- ch <- m
- }
- }
- func main() {
- workerCA := NewClusterManager("xiaodian")
- reg := prometheus.NewPedanticRegistry()
- reg.MustRegister(workerCA)
- //當(dāng)promhttp.Handler()被執(zhí)行時(shí),所有metric被序列化輸出。題外話,其實(shí)輸出的格式既可以是plain text,也可以是protocol Buffers。
- http.Handle("/metrics", promhttp.HandlerFor(reg, promhttp.HandlerOpts{}))
- http.ListenAndServe(":8888", nil)
- }
此時(shí)就可以去http://localhost:8888/metrics 看到傳遞過(guò)去的數(shù)據(jù)了。
高質(zhì)量Exporter的編寫(xiě)原則與方法
主要方法
參考鏈接:https://prometheus.io/docs/instrumenting/writing_exporters/。1.在訪問(wèn)Exporter的主頁(yè)(即http://yourExporter/這樣的根路徑)時(shí),它會(huì)返回一個(gè)簡(jiǎn)單的頁(yè)面,這就是Exporter的落地頁(yè)(Landing Page)。落地頁(yè)中可以放文檔和幫助信息,包括監(jiān)控指標(biāo)項(xiàng)的說(shuō)明。落地頁(yè)上還包括最近執(zhí)行的檢查列表、列表的狀態(tài)以及調(diào)試信息,這對(duì)故障排查非常有幫助。
2.一臺(tái)服務(wù)器或者容器上可能會(huì)有許多Exporter和Prometheus組件,它們都有自己的端口號(hào)。因此,在寫(xiě)Exporter和發(fā)布Exporter之前,需要檢查新添加的端口是否已經(jīng)被使用[1],建議使用默認(rèn)端口分配范圍之外的端口。
3.我們應(yīng)該根據(jù)業(yè)務(wù)類型設(shè)計(jì)好指標(biāo)的#HELP#TYPE的格式。這些指標(biāo)往往是可配置的,包括默認(rèn)開(kāi)啟的指標(biāo)和默認(rèn)關(guān)閉的指標(biāo)。這是因?yàn)榇蟛糠种笜?biāo)并不會(huì)真正被用到,設(shè)計(jì)過(guò)多的指標(biāo)不僅會(huì)消耗不必要的資源,還會(huì)影響整體的性能。
其他方法
對(duì)于如何寫(xiě)高質(zhì)量Exporter,除了合理分配端口號(hào)、設(shè)計(jì)落地頁(yè)、梳理指標(biāo)這3個(gè)方面外,還有一些其他的原則。
- 記錄Exporter本身的運(yùn)行狀態(tài)指標(biāo)。
- 可配置化進(jìn)行功能的啟用和關(guān)閉。
- 推薦使用YAML作為配置格式。
- 遵循度量標(biāo)準(zhǔn)命名的最佳實(shí)踐[2],特別是_count、_sum、_total、_bucket和info等問(wèn)題。
- 為度量提供正確的單位。
- 標(biāo)簽的唯一性、可讀性及必要的冗余信息設(shè)計(jì)。
- 通過(guò)Docker等方式一鍵配置Exporter。
- 盡量使用Collectors方式收集指標(biāo),如Go語(yǔ)言中的MustNewConstMetric。
- 提供scrapes刮擦失敗的錯(cuò)誤設(shè)計(jì),這有助于性能調(diào)試。
- 盡量不要重復(fù)提供已有的指標(biāo),如Node Exporter已經(jīng)提供的CPU、磁盤等信息。
- 向Prometheus公開(kāi)原始的度量數(shù)據(jù),不建議自行計(jì)算,Exporter的核心是采集原始指標(biāo)。
Redis Exporter源碼解析
在本章中,讀者可以發(fā)現(xiàn)開(kāi)源領(lǐng)域有著不計(jì)其數(shù)的Exporter,阿里巴巴開(kāi)源的Exporter就有RocketMQ Exporter、Sentinel Exporter、Sentry Exporter、Alibaba Cloud Exporter等多種。編寫(xiě)Exporter和編寫(xiě)Spring Boot Starter一樣,可以多參考其他優(yōu)秀的開(kāi)源軟件的代碼。本節(jié)就來(lái)簡(jiǎn)單分析一下運(yùn)維工作中用到的Redis Exporter源碼。在使用Redis Exporter時(shí),可以通過(guò)redis_exporter--help命令查看完整的參數(shù)列表。默認(rèn)情況下,它在端口9192上運(yùn)行,并在路徑/metrics上暴露指標(biāo)。可以通過(guò)--web.listen-addres和--web.telemetry-path命令來(lái)設(shè)置端口和路徑,代碼如下所示。
- redis_exporter -web.listen-address=":8888" -web.telemetry-path="/node_metrics"
上述代碼將修改redis Exporter綁定到端口8888并在路徑/node_metrics上暴露指標(biāo)。這個(gè)邏輯是在源碼redis_exporter.go中實(shí)現(xiàn)的.Redis Exporter[3]主要通過(guò)Redis原生的命令獲取Redis所有的信息,它支持2.x、3.x、4.x、5.x和6.x版本。在源碼中,可以看到多處使用了doRedisCmd方法發(fā)送命令以獲取性能指標(biāo),代碼如下所示。主要是通過(guò)原生的INFO命令獲取所有性能信息。該命令的返回結(jié)果詳情參考[4]。
- infoAll, err := redis.String(doRedisCmd(c, "INFO", "ALL"))
生成的infoAll信息通過(guò)func (e *Exporter) extractInfoMetrics(ch chan<- prometheus.Metric, info string, dbCount int)繼續(xù)處理。它的主要目的是遍歷查詢到的結(jié)果,根據(jù)指標(biāo)生成一個(gè)hash值。源代碼如下所示:
- func (e *Exporter) extractInfoMetrics(ch chan<- prometheus.Metric, info string, dbCount int) {
- keyValues := map[string]string{}
- handledDBs := map[string]bool{}
- fieldClass := ""
- //以換行符進(jìn)行分割
- lines := strings.Split(info, "\n")
- masterHost := ""
- masterPort := ""
- //遍歷查詢到的結(jié)果,根據(jù)指標(biāo)生成一個(gè)hash值
- for _, line := range lines {
- line = strings.TrimSpace(line)
- log.Debugf("info: %s", line)
- //去除帶#的注釋文件
- if len(line) > 0 && strings.HasPrefix(line, "# ") {
- fieldClass = line[2:]
- log.Debugf("set fieldClass: %s", fieldClass)
- continue
- }
- //去除不帶:的或者字符小于2的
- if (len(line) < 2) || (!strings.Contains(line, ":")) {
- continue
- }
- //以冒號(hào)進(jìn)行分割
- split := strings.SplitN(line, ":", 2)
- fieldKey := split[0]
- fieldValue := split[1]
- //將指標(biāo)名稱與值存到hash中
- keyValues[fieldKey] = fieldValue
- if fieldKey == "master_host" {
- masterHost = fieldValue
- }
- if fieldKey == "master_port" {
- masterPort = fieldValue
- }
- //按照集群和副本和哨兵模式進(jìn)行處理
- switch fieldClass {
- case "Replication":
- if ok := e.handleMetricsReplication(ch, masterHost, masterPort, fieldKey, fieldValue); ok {
- continue
- }
- case "Server":
- e.handleMetricsServer(ch, fieldKey, fieldValue)
- case "Commandstats":
- e.handleMetricsCommandStats(ch, fieldKey, fieldValue)
- continue
- case "Keyspace":
- if keysTotal, keysEx, avgTTL, ok := parseDBKeyspaceString(fieldKey, fieldValue); ok {
- dbName := fieldKey
- e.registerConstMetricGauge(ch, "db_keys", keysTotal, dbName)
- e.registerConstMetricGauge(ch, "db_keys_expiring", keysEx, dbName)
- if avgTTL > -1 {
- e.registerConstMetricGauge(ch, "db_avg_ttl_seconds", avgTTL, dbName)
- }
- handledDBs[dbName] = true
- continue
- }
- case "Sentinel":
- e.handleMetricsSentinel(ch, fieldKey, fieldValue)
- }
- if !e.includeMetric(fieldKey) {
- continue
- }
- //將收集到信息進(jìn)行按照一定規(guī)則進(jìn)行處理
- e.parseAndRegisterConstMetric(ch, fieldKey, fieldValue)
- }
- for dbIndex := 0; dbIndex < dbCount; dbIndex++ {
- dbName := "db" + strconv.Itoa(dbIndex)
- if _, exists := handledDBs[dbName]; !exists {
- e.registerConstMetricGauge(ch, "db_keys", 0, dbName)
- e.registerConstMetricGauge(ch, "db_keys_expiring", 0, dbName)
- }
- }
- e.registerConstMetricGauge(ch, "instance_info", 1,
- keyValues["role"],
- keyValues["redis_version"],
- keyValues["redis_build_id"],
- keyValues["redis_mode"],
- keyValues["os"],
- keyValues["maxmemory_policy"],
- keyValues["tcp_port"], keyValues["run_id"], keyValues["process_id"],
- )
- if keyValues["role"] == "slave" {
- e.registerConstMetricGauge(ch, "slave_info", 1,
- keyValues["master_host"],
- keyValues["master_port"],
- keyValues["slave_read_only"])
- }
- }
然后通過(guò)e.parseAndRegisterConstMetric(ch, fieldKey, fieldValue)方法,將收集到hash中的信息,按照一定的規(guī)則生成prometheus.Metric。核心代碼如下:
- func (e *Exporter) registerConstMetric(ch chan<- prometheus.Metric, metric string, val float64, valType prometheus.ValueType, labelValues ...string) {
- descr := e.metricDescriptions[metric]
- if descr == nil {
- descr = newMetricDescr(e.options.Namespace, metric, metric+" metric", labelValues)
- }
- if m, err := prometheus.NewConstMetric(descr, valType, val, labelValues...); err == nil {
- ch <- m
- }
- }
最后*Exporter.Collect的方法調(diào)用registerConstMetric方法,就完成了redis的info指標(biāo)的收集。其他指標(biāo)的收集原來(lái)也是相同的,有興趣的讀者可以自行閱讀。
總結(jié)
本文介紹了Exporter的概念。Exporter的來(lái)源主要有兩個(gè):一個(gè)是社區(qū)提供的,一個(gè)是用戶自定義的。在實(shí)際生產(chǎn)中,官方提供的Exporter主要涵蓋數(shù)據(jù)庫(kù)、硬件、問(wèn)題跟蹤及持續(xù)集成、消息系統(tǒng)、存儲(chǔ)、HTTP、API、日志、其他監(jiān)控系統(tǒng)等,這些已有的Exporter可以滿足絕大多數(shù)開(kāi)發(fā)人員及運(yùn)維人員的需求。對(duì)于系統(tǒng)、軟件沒(méi)有Exporter的情況,本章也從數(shù)據(jù)規(guī)范、數(shù)據(jù)采集方式、代碼案例撰寫(xiě)等方面帶領(lǐng)讀者體驗(yàn)了Exporter的設(shè)計(jì)與實(shí)踐,一步步指導(dǎo)讀者打造定制化Exporter。為了幫助讀者形成良好的代碼風(fēng)格并能夠真正編寫(xiě)高質(zhì)量Exporter,本章還給出了編寫(xiě)高質(zhì)量Exporter的建議,并結(jié)合 Redis Exporter的原理進(jìn)行了實(shí)戰(zhàn)解析。通過(guò)對(duì)本章的學(xué)習(xí),讀者可以掌握使用和定制Exporter的能力。
[1] Exporter端口列表:https://github.com/prometheus/prometheus/wiki/Default-port-allocations。
[2] 標(biāo)準(zhǔn)命名最佳實(shí)踐:https://prometheus.io/docs/practices/naming。
[3] Redis Exporter地址:https://github.com/oliver006/redis_Exporter。
[4] Redis INFO命令地址:https://redis.io/commands/info。