線上CPU100%及應用OOM的排查和解決過程
最近工作又遇到幾次線上告警的問題,排查基本上就是cup100%以及內存OOM問題,再分享一下之前遇到這類問題排查的一些思路和過程,希望對你有所幫助,感謝你的閱讀。
問題現象
【告警通知-應用異常告警】
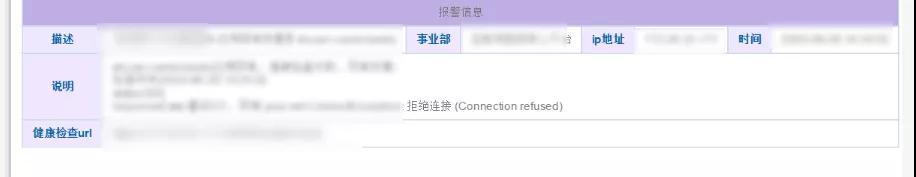
簡單看下告警的信息:拒絕連接,反正就是服務有問題了,請不要太在意馬賽克。
環境說明
Spring Cloud F版。
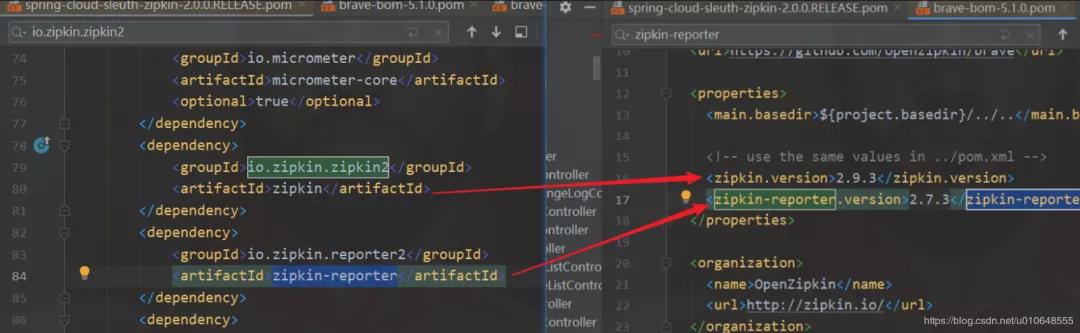
項目中默認使用 spring-cloud-sleuth-zipkin 依賴得到 zipkin-reporter。分析的版本發現是 zipkin-reporter版本是 2.7.3 。
- <dependency>
- <groupId>org.springframework.cloud</groupId>
- <artifactId>spring-cloud-sleuth-zipkin</artifactId>
- </dependency>
版本:2.0.0.RELEASE
版本說明
問題排查
通過告警信息,知道是哪一臺服務器的哪個服務出現問題。首先登錄服務器進行檢查。
1、檢查服務狀態和驗證健康檢查URL是否ok
“這一步可忽略/跳過,與實際公司的的健康檢查相關,不具有通用性。
①查看服務的進程是否存在。
“ps -ef | grep 服務名 ps -aux | grep 服務名
②查看對應服務健康檢查的地址是否正常,檢查 ip port 是否正確
“是不是告警服務檢查的url配置錯了,一般這個不會出現問題
③驗證健康檢查地址
“這個健康檢查地址如:http://192.168.1.110:20606/serviceCheck 檢查 IP 和 Port 是否正確。
- # 服務正常返回結果
- curl http://192.168.1.110:20606/serviceCheck
- {"appName":"test-app","status":"UP"}
- # 服務異常,服務掛掉
- curl http://192.168.1.110:20606/serviceCheck
- curl: (7) couldn't connect to host
2、查看服務的日志
查看服務的日志是否還在打印,是否有請求進來。查看發現服務OOM了。
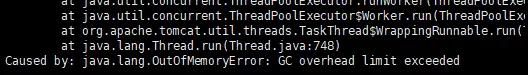
OOM錯誤
tips:java.lang.OutOfMemoryError GC overhead limit exceeded
oracle官方給出了這個錯誤產生的原因和解決方法:Exception in thread thread_name: java.lang.OutOfMemoryError: GC Overhead limit exceeded Cause: The detail message "GC overhead limit exceeded" indicates that the garbage collector is running all the time and Java program is making very slow progress. After a garbage collection, if the Java process is spending more than approximately 98% of its time doing garbage collection and if it is recovering less than 2% of the heap and has been doing so far the last 5 (compile time constant) consecutive garbage collections, then a java.lang.OutOfMemoryError is thrown. This exception is typically thrown because the amount of live data barely fits into the Java heap having little free space for new allocations. Action: Increase the heap size. The java.lang.OutOfMemoryError exception for GC Overhead limit exceeded can be turned off with the command line flag -XX:-UseGCOverheadLimit.
原因:大概意思就是說,JVM花費了98%的時間進行垃圾回收,而只得到2%可用的內存,頻繁的進行內存回收(最起碼已經進行了5次連續的垃圾回收),JVM就會曝出ava.lang.OutOfMemoryError: GC overhead limit exceeded錯誤。

上面tips來源:java.lang.OutOfMemoryError GC overhead limit exceeded原因分析及解決方案
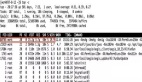
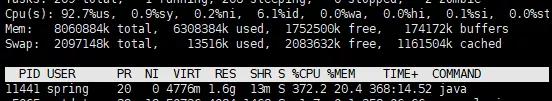
3、檢查服務器資源占用狀況
查詢系統中各個進程的資源占用狀況,使用 top 命令。查看出有一個進程為 11441 的進程 CPU 使用率達到300%,如下截圖:
CPU爆表
然后 查詢這個進程下所有線程的CPU使用情況:
top -H -p pid 保存文件:top -H -n 1 -p pid > /tmp/pid_top.txt
- # top -H -p 11441
- PID USER PR NI VIRT RES SHR S %CPU %MEM TIME+ COMMAND
- 11447 test 20 0 4776m 1.6g 13m R 92.4 20.3 74:54.19 java
- 11444 test 20 0 4776m 1.6g 13m R 91.8 20.3 74:52.53 java
- 11445 test 20 0 4776m 1.6g 13m R 91.8 20.3 74:50.14 java
- 11446 test 20 0 4776m 1.6g 13m R 91.4 20.3 74:53.97 java
- ....
查看 PID:11441 下面的線程,發現有幾個線程占用cpu較高。
4、保存堆棧數據
1、打印系統負載快照
- top -b -n 2 > /tmp/top.txt
- top -H -n 1 -p pid > /tmp/pid_top.txt
2、cpu升序打印進程對應線程列表
- ps -mp-o THREAD,tid,time | sort -k2r > /tmp/進程號_threads.txt
3、看tcp連接數 (最好多次采樣)
- lsof -p 進程號 > /tmp/進程號_lsof.txt
- lsof -p 進程號 > /tmp/進程號_lsof2.txt
4、查看線程信息 (最好多次采樣)
- jstack -l 進程號 > /tmp/進程號_jstack.txt
- jstack -l 進程號 > /tmp/進程號_jstack2.txt
- jstack -l 進程號 > /tmp/進程號_jstack3.txt
5、查看堆內存占用概況
- jmap -heap 進程號 > /tmp/進程號_jmap_heap.txt
6、查看堆中對象的統計信息
- jmap -histo 進程號 | head -n 100 > /tmp/進程號_jmap_histo.txt
7、查看GC統計信息
- jstat -gcutil 進程號 > /tmp/進程號_jstat_gc.txt
8、生產對堆快照Heap dump
- jmap -dump:format=b,file=/tmp/進程號_jmap_dump.hprof 進程號
“堆的全部數據,生成的文件較大。
jmap -dump:live,format=b,file=/tmp/進程號_live_jmap_dump.hprof 進程號
“dump:live,這個參數表示我們需要抓取目前在生命周期內的內存對象,也就是說GC收不走的對象,一般用這個就行。
拿到出現問題的快照數據,然后重啟服務。
問題分析
根據上述的操作,已經獲取了出現問題的服務的GC信息、線程堆棧、堆快照等數據。下面就進行分析,看問題到底出在哪里。
1、分析cpu占用100%的線程
轉換線程ID
從jstack生成的線程堆棧進程分析。
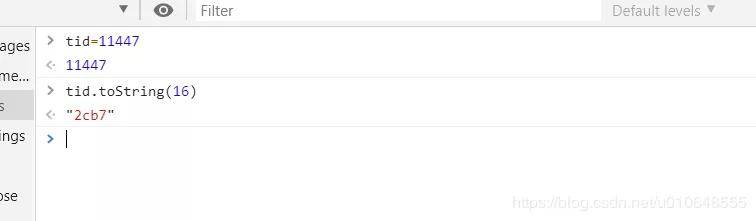
將 上面線程ID 為
- 11447 :0x2cb7
- 11444 :0x2cb4
- 11445 :0x2cb5
- 11446 :0x2cb6
轉為 16進制(jstack命令輸出文件記錄的線程ID是16進制)。
第一種轉換方法 :
- $ printf “0x%x” 11447
- “0x2cb7”
第二種轉換方法 : 在轉換的結果加上 0x即可。
查找線程堆棧
- $ cat 11441_jstack.txt | grep "GC task thread"
- "GC task thread#0 (ParallelGC)" os_prio=0 tid=0x00007f971401e000 nid=0x2cb4 runnable
- "GC task thread#1 (ParallelGC)" os_prio=0 tid=0x00007f9714020000 nid=0x2cb5 runnable
- "GC task thread#2 (ParallelGC)" os_prio=0 tid=0x00007f9714022000 nid=0x2cb6 runnable
- "GC task thread#3 (ParallelGC)" os_prio=0 tid=0x00007f9714023800 nid=0x2cb7 runnable
發現這些線程都是在做GC操作。
2、分析生成的GC文件
- S0 S1 E O M CCS YGC YGCT FGC FGCT GCT
- 0.00 0.00 100.00 99.94 90.56 87.86 875 9.307 3223 5313.139 5322.446
- S0:幸存1區當前使用比例
- S1:幸存2區當前使用比例
- E:Eden Space(伊甸園)區使用比例
- O:Old Gen(老年代)使用比例
- M:元數據區使用比例
- CCS:壓縮使用比例
- YGC:年輕代垃圾回收次數
- FGC:老年代垃圾回收次數
- FGCT:老年代垃圾回收消耗時間
- GCT:垃圾回收消耗總時間
FGC 十分頻繁。
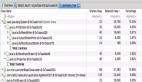
3、分析生成的堆快照
使用 Eclipse Memory Analyzer 工具。下載地址:https://www.eclipse.org/mat/downloads.php
分析的結果:
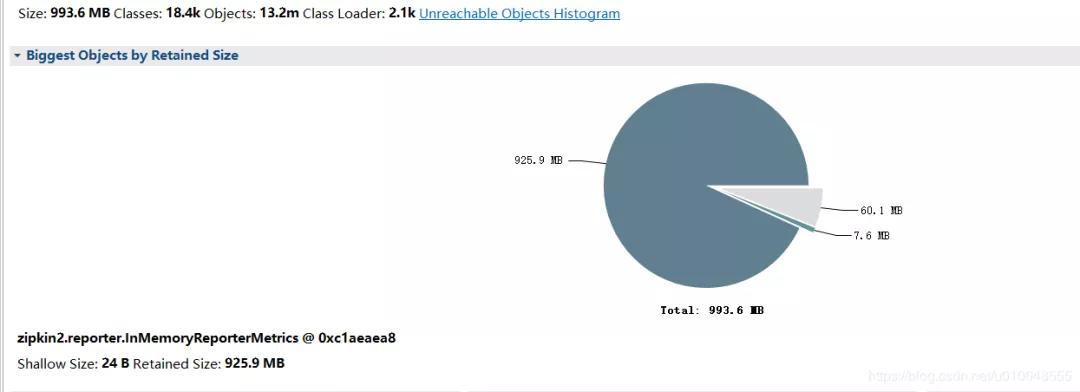
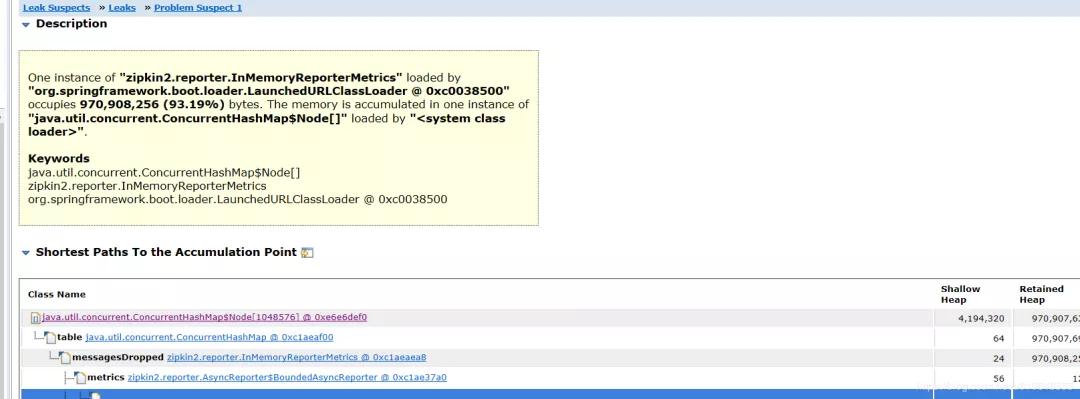
看到堆積的大對象的具體內容:
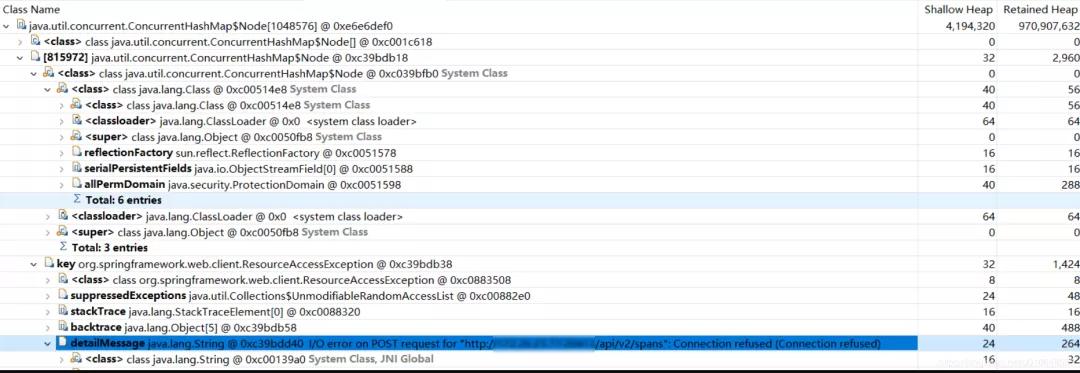
問題大致原因,InMemoryReporterMetrics 引起的OOM。
- zipkin2.reporter.InMemoryReporterMetrics @ 0xc1aeaea8
- Shallow Size: 24 B Retained Size: 925.9 MB
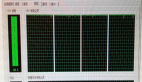
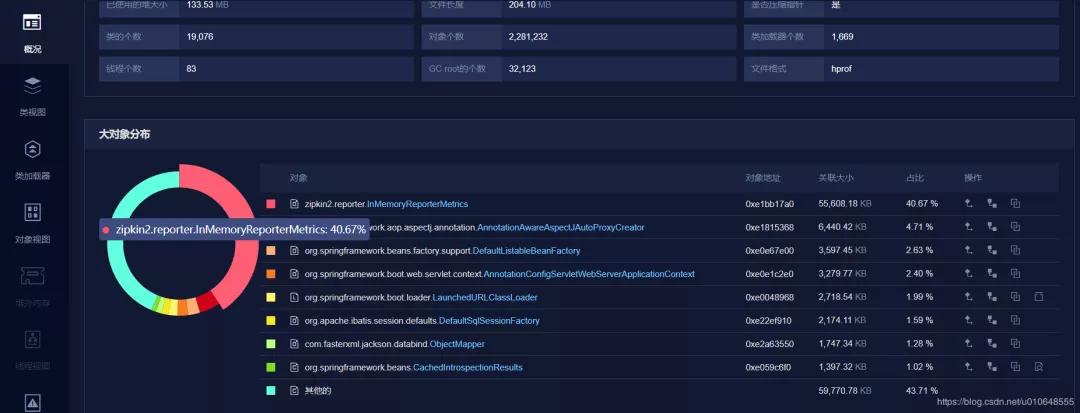
也可以使用:Java內存Dump(https://www.perfma.com/docs/memory/memory-start)進行分析,如下截圖,功能沒有MAT強大,有些功能需收費。
4、原因分析和驗證
因為出現了這個問題,查看出現問題的這個服務 zipkin的配置,和其他服務沒有區別。發現配置都一樣。
然后看在試著對應的 zipkin 的jar包,發現出現問題的這個服務依賴的 zipkin版本較低。
有問題的服務的 zipkin-reporter-2.7.3.jar
其他沒有問題的服務 依賴的包 :zipkin-reporter-2.8.4.jar
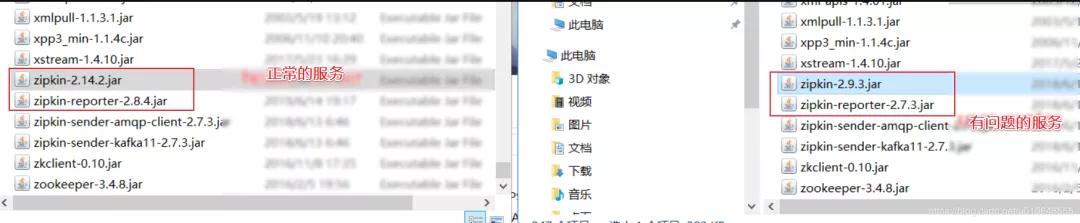
將有問題的服務依賴的包版本升級,在測試環境進行驗證,查看堆棧快照發現沒有此問題了。
原因探索
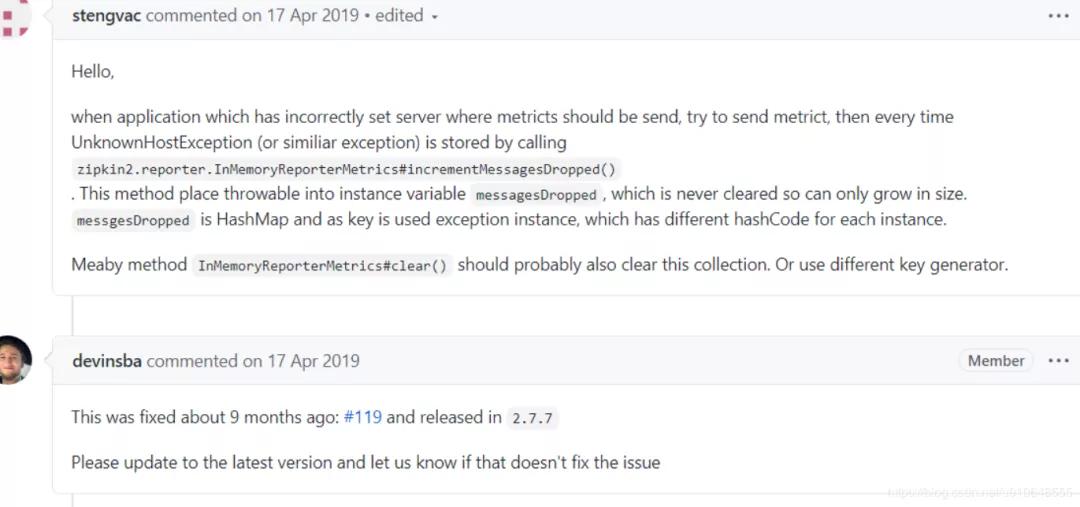
查 zipkin-reporter的 github:搜索 相應的資料
https://github.com/openzipkin/zipkin-reporter-java/issues?q=InMemoryReporterMetrics
找到此 下面這個issues:
https://github.com/openzipkin/zipkin-reporter-java/issues/139
修復代碼和驗證代碼:
https://github.com/openzipkin/zipkin-reporter-java/pull/119/files
對比兩個版本代碼的差異:
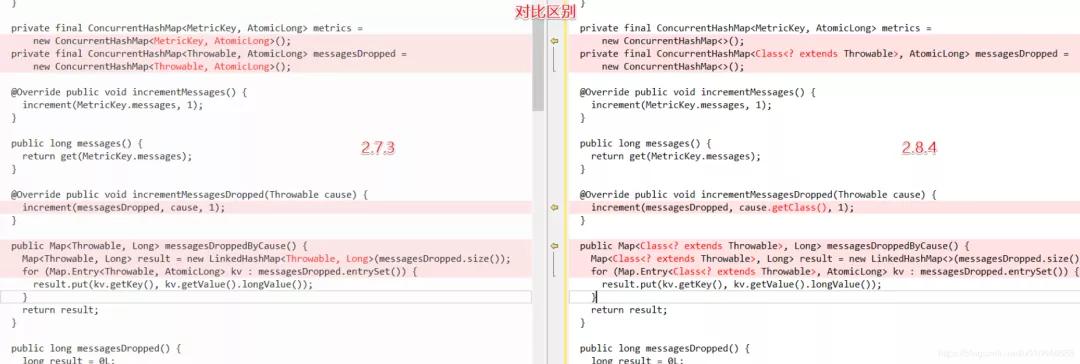
簡單的DEMO驗證:
- // 修復前的代碼:
- private final ConcurrentHashMap<Throwable, AtomicLong> messagesDropped =
- new ConcurrentHashMap<Throwable, AtomicLong>();
- // 修復后的代碼:
- private final ConcurrentHashMap<Class<? extends Throwable>, AtomicLong> messagesDropped =
- new ConcurrentHashMap<>();
修復后使用 這個key :Class 替換 Throwable。
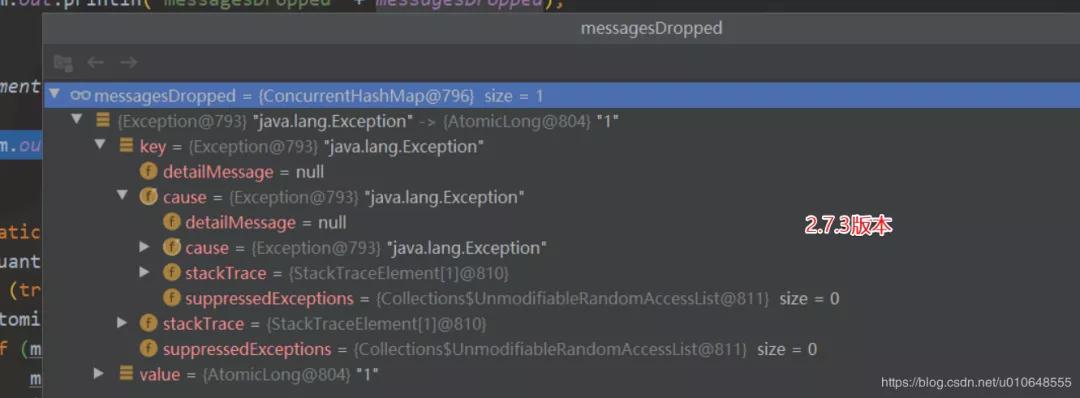
簡單驗證:

解決方案
將zipkin-reporter 版本進行升級即可。使用下面依賴配置,引入的 zipkin-reporter版本為 2.8.4 。
- <!-- zipkin 依賴包 -->
- <dependency>
- <groupId>io.zipkin.brave</groupId>
- <artifactId>brave</artifactId>
- <version>5.6.4</version>
- </dependency>
小建議:配置JVM參數的時候還是加上下面參數,設置內存溢出的時候輸出堆棧快照.
- -XX:+HeapDumpOnOutOfMemoryError
- -XX:HeapDumpPath=path/filename.hprof
參考文章
記一次sleuth發送zipkin異常引起的OOM
https://www.jianshu.com/p/f8c74943ccd8
本文轉載自微信公眾號「Java編程技術樂園」,可以通過以下二維碼關注。轉載本文請聯系Java編程技術樂園公眾號。