Go 程序崩了?煎魚教你用 PProf 工具來救火!
本文轉載自微信公眾號「腦子進煎魚了」,作者陳煎魚。轉載本文請聯系腦子進煎魚了公眾號。
前言
應用程序在運行時,總是會出現一些你所意料不到的問題,像是跑著跑著突然報警,監控提示你進程 CPU 使用率過高、內存占用不斷增大(疑似泄露)、臨時內存大量申請后長時間內不滑,又或是 Goroutine 泄露、出現 Goroutine 數量暴漲,并且持續保持,甚至是莫名其妙在某次迭代發布后的數小時內出現了應用程序無法提供服務的問題...
這發生起來的話,是多么的讓人感到擔憂,那么除了在我們平時要做好各類防護以外,在問題正在發生時,我們又有什么辦法排查呢,因此在這個章節,我們將介紹排查辦法之一,也就是 Go 語言的性能剖析大殺器 PProf 工具鏈,它是 Go 語言中必知必會的技能點。
PProf 是什么
在 Go 語言中,PProf 是用于可視化和分析性能分析數據的工具,PProf 以 profile.proto 讀取分析樣本的集合,并生成報告以可視化并幫助分析數據(支持文本和圖形報告)。
而剛剛提到的 profile.proto 是一個 Protobuf v3 的描述文件,它描述了一組 callstack 和 symbolization 信息, 作用是統計分析的一組采樣的調用棧,是很常見的 stacktrace 配置文件格式。
有哪幾種采樣方式
- runtime/pprof:采集程序(非 Server)的指定區塊的運行數據進行分析。
- net/http/pprof:基于HTTP Server運行,并且可以采集運行時數據進行分析。
- go test:通過運行測試用例,并指定所需標識來進行采集。
支持什么使用模式
- Report generation:報告生成。
- Interactive terminal use:交互式終端使用。
- Web interface:Web 界面。
可以做什么
- CPU Profiling:CPU 分析,按照一定的頻率采集所監聽的應用程序 CPU(含寄存器)的使用情況,可確定應用程序在主動消耗 CPU 周期時花費時間的位置。
- Memory Profiling:內存分析,在應用程序進行堆分配時記錄堆棧跟蹤,用于監視當前和歷史內存使用情況,以及檢查內存泄漏。
- Block Profiling:阻塞分析,記錄Goroutine阻塞等待同步(包括定時器通道)的位置,默認不開啟,需要調用runtime.SetBlockProfileRate進行設置。
- Mutex Profiling:互斥鎖分析,報告互斥鎖的競爭情況,默認不開啟,需要調用runtime.SetMutexProfileFraction進行設置。
- Goroutine Profiling:Goroutine 分析,可以對當前應用程序正在運行的 Goroutine 進行堆棧跟蹤和分析。
其中像是 Goroutine Profiling 這項功能會在實際排查中會經常用到。
因為很多問題出現時的表象就是 Goroutine 暴增,而這時候我們要做的事情之一就是查看應用程序中的 Goroutine 正在做什么事情,因為什么阻塞了,然后再進行下一步。
介紹和使用
一個簡單的例子
我們新建一個 main.go 文件,用于后續的應用程序分析和示例展示,寫入如下代碼:
- var datas []string
- func main() {
- go func() {
- for {
- log.Printf("len: %d", Add("go-programming-tour-book"))
- time.Sleep(time.Millisecond * 10)
- }
- }()
- _ = http.ListenAndServe("0.0.0.0:6060", nil)
- }
- func Add(str string) int {
- data := []byte(str)
- datas = append(datas, string(data))
- return len(datas)
- }
接下來最重要的一步,就是在 import 中添加 _ "net/http/pprof" 的引用,如下:
- import (
- _ "net/http/pprof"
- ...
- )
接下來我們運行這個程序,訪問 http://127.0.0.1:6060/debug/pprof/ 地址,檢查是否正常響應。
通過瀏覽器訪問
第一種方式,我們可以直接通過瀏覽器,進行查看,那么在第一步我們可以先查看總覽頁面,也就是訪問 http://127.0.0.1:6060/debug/pprof/,如下:
- /debug/pprof/
- Types of profiles available:
- Count Profile
- 3 allocs
- 0 block
- 0 cmdline
- 8 goroutine
- 3 heap
- 0 mutex
- 0 profile
- 11 threadcreate
- 0 trace
- full goroutine stack dump
- allocs:查看過去所有內存分配的樣本,訪問路徑為$HOST/debug/pprof/allocs。
- block:查看導致阻塞同步的堆棧跟蹤,訪問路徑為$HOST/debug/pprof/block。
- cmdline:當前程序的命令行的完整調用路徑。
- goroutine:查看當前所有運行的 goroutines 堆棧跟蹤,訪問路徑為$HOST/debug/pprof/goroutine。
- heap:查看活動對象的內存分配情況, 訪問路徑為$HOST/debug/pprof/heap。
- mutex:查看導致互斥鎖的競爭持有者的堆棧跟蹤,訪問路徑為$HOST/debug/pprof/mutex。
- profile:默認進行 30s 的 CPU Profiling,得到一個分析用的 profile 文件,訪問路徑為$HOST/debug/pprof/profile。
- threadcreate:查看創建新OS線程的堆棧跟蹤,訪問路徑為$HOST/debug/pprof/threadcreate。
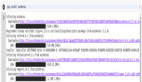
如果你在對應的訪問路徑上新增 ?debug=1 的話,就可以直接在瀏覽器訪問,如下:
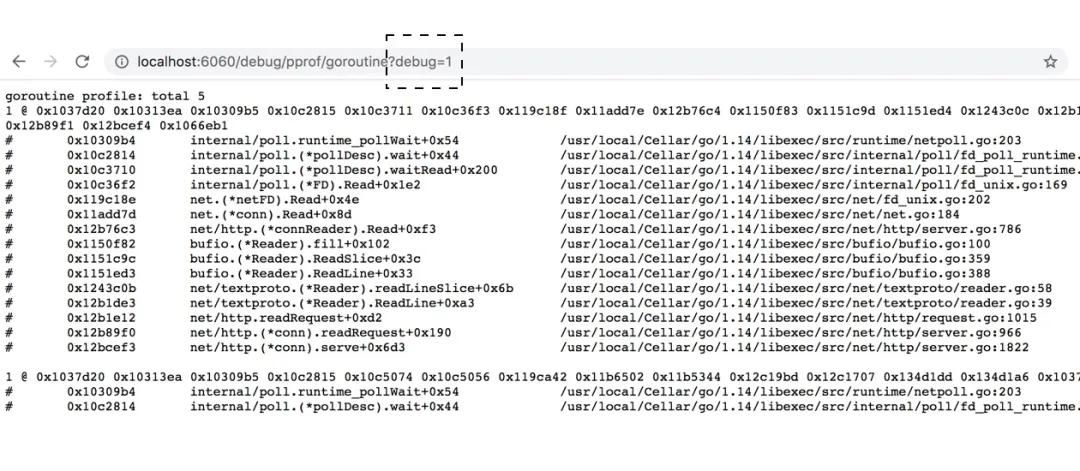
debug 模式
若不新增 debug 參數,那么將會直接下載對應的profile文件。
再展開來講,在部署環境中,我們為了網絡安全,通常不會直接對外網暴露 pprof 的相關端口,因此會通過 curl、wget 等方式進行 profile 文件的間接拉取。
另外還有一點需要注意,debug 的訪問方式是具有時效性的,在實際場景中,我們常常需要及時將當前狀態下的 profile 文件給存儲下來,便于二次分析。
通過交互式終端使用
第二種方式,我們可以直接通過命令行,來完成對正在運行的應用程序 pprof 的抓取和分析。
CPU Profiling
- $ go tool pprof http://localhost:6060/debug/pprof/profile\?seconds\=60
- Fetching profile over HTTP from http://localhost:6060/debug/pprof/profile?seconds=60
- Saved profile in /Users/eddycjy/pprof/pprof.samples.cpu.002.pb.gz
- Type: cpu
- Duration: 1mins, Total samples = 37.25s (61.97%)
- Entering interactive mode (type "help" for commands, "o" for options)
- (pprof)
執行該命令后,需等待 60 秒(可調整 seconds 的值),pprof 會進行 CPU Profiling,結束后將默認進入 pprof 的命令行交互式模式,可以對分析的結果進行查看或導出。另外如果你所啟動的 HTTP Server 是 TLS 的方式,那么在調用 go tool pprof 時,需要將調用路徑改為:go tool pprof https+insecure://localhost:6060/debug/pprof/profile\?seconds\=60。
接下來我們輸入查詢命令 top10 ,以此查看對應資源開銷(例如:CPU 就是執行耗時/開銷、Memory 就是內存占用大小)排名前十的函數,如下:
- (pprof) top10
- Showing nodes accounting for 36.23s, 97.26% of 37.25s total
- Dropped 80 nodes (cum <= 0.19s)
- Showing top 10 nodes out of 34
- flat flat% sum% cum cum% Name
- 32.63s 87.60% 87.60% 32.70s 87.79% syscall.syscall
- 0.87s 2.34% 89.93% 0.88s 2.36% runtime.stringtoslicebyte
- 0.69s 1.85% 91.79% 0.69s 1.85% runtime.memmove
- 0.52s 1.40% 93.18% 0.52s 1.40% runtime.nanotime
- ...
- (pprof)
- flat:函數自身的運行耗時。
- flat%:函數自身在 CPU 運行耗時總比例。
- sum%:函數自身累積使用 CPU 總比例。
- cum:函數自身及其調用函數的運行總耗時。
- cum%:函數自身及其調用函數的運行耗時總比例。
- Name:函數名。
在大多數的情況下,我們可以通過這五列得出一個應用程序的運行情況,知道當前是什么函數,正在做什么事情,占用了多少資源,誰又是占用資源的大頭,以此來得到一個初步的分析方向。
另外在交互命令行中,pprof 還支持了大量的其它命令,具體可執行 pprof help 查看幫助說明。
Heap Profiling
- $ go tool pprof http://localhost:6060/debug/pprof/heap
- Fetching profile over HTTP from http://localhost:6060/debug/pprof/heap
- Saved profile in /Users/eddycjy/pprof/pprof.alloc_objects.alloc_space.inuse_objects.inuse_space.011.pb.gz
- Type: inuse_space
- Entering interactive mode (type "help" for commands, "o" for options)
- (pprof)
執行該命令后,能夠很快的拉取到其結果,因為它不需要像 CPU Profiling 做采樣等待,這里需要注意的一點是 Type 這一個選項,你可以看到它默認顯示的是 inuse_space,實際上可以針對多種內存概況進行分析,常用的類別如下:
- inuse_space:分析應用程序的常駐內存占用情況。
- $ go tool pprof -inuse_space http://localhost:6060/debug/pprof/heap
- (pprof) top
- Showing nodes accounting for 4.01GB, 100% of 4.01GB total
- flat flat% sum% cum cum%
- 4.01GB 100% 100% 4.01GB 100% main.Add
- 0 0% 100% 4.01GB 100% main.main.func1
- alloc_objects:分析應用程序的內存臨時分配情況。
- $ go tool pprof -alloc_objects http://localhost:6060/debug/pprof/heap
- (pprof) top
- Showing nodes accounting for 215552550, 100% of 215560746 total
- Dropped 14 nodes (cum <= 1077803)
- flat flat% sum% cum cum%
- 86510197 40.13% 40.13% 86510197 40.13% main.Add
- 85984544 39.89% 80.02% 85984544 39.89% fmt.Sprintf
- 43057809 19.97% 100% 215552550 100% main.main.func1
- 0 0% 100% 85984544 39.89% log.Printf
另外還有 inuse_objects 和 alloc_space 類別,分別對應查看每個函數所分別的對象數量和查看分配的內存空間大小,具體可根據情況選用。
Goroutine Profiling
- $ go tool pprof http://localhost:6060/debug/pprof/goroutine
- Fetching profile over HTTP from http://localhost:6060/debug/pprof/goroutine
- Saved profile in /Users/eddycjy/pprof/pprof.goroutine.003.pb.gz
- Type: goroutine
- Entering interactive mode (type "help" for commands, "o" for options)
- (pprof)
在查看 goroutine 時,我們可以使用traces命令,這個命令會打印出對應的所有調用棧,以及指標信息,可以讓我們很便捷的查看到整個調用鏈路有什么,分別在哪里使用了多少個 goroutine,并且能夠通過分析查看到誰才是真正的調用方,輸出結果如下:
- (pprof) traces
- Type: goroutine
- -----------+-------------------------------------------------------
- 2 runtime.gopark
- runtime.netpollblock
- internal/poll.runtime_pollWait
- ...
- -----------+-------------------------------------------------------
- 1 runtime.gopark
- runtime.netpollblock
- ...
- net/http.ListenAndServe
- main.main
- runtime.main
在調用棧上來講,其展示順序是自下而上的,也就是 runtime.main 方法調用了 main.main 方法,main.main 方法又調用了 net/http.ListenAndServe 方法,這里對應的也就是我們所使用的示例代碼了,排查起來會非常方便。
每個調用堆棧信息用 ----------- 分割,函數方法前的就是指標數據,像 Goroutine Profiling 展示是就是該方法占用的 goroutine 的數量。而 Heap Profiling 展示的就是占用的內存大小,如下:
- $ go tool pprof http://localhost:6060/debug/pprof/heap
- ...
- Type: inuse_space
- Entering interactive mode (type "help" for commands, "o" for options)
- (pprof) traces
- Type: inuse_space
- -----------+-------------------------------------------------------
- bytes: 13.55MB
- 13.55MB main.Add
- main.main.func1
- -----------+-------------------------------------------------------
實際上 pprof 中的所有功能都會根據不同的 Profile 類型展示不同的對應結果。
Mutex Profiling
怎么樣的情況下會造成阻塞呢,一般有如下方式:調用 chan(通道)、調用 sync.Mutex (同步鎖)、調用 time.Sleep() 等等。那么為了驗證互斥鎖的競爭持有者的堆棧跟蹤,我們可以根據以上的 sync.Mutex 方式,來調整先前的示例代碼,代碼如下:
- func init() {
- runtime.SetMutexProfileFraction(1)
- }
- func main() {
- var m sync.Mutex
- var datas = make(map[int]struct{})
- for i := 0; i < 999; i++ {
- go func(i int) {
- m.Lock()
- defer m.Unlock()
- datas[i] = struct{}{}
- }(i)
- }
- _ = http.ListenAndServe(":6061", nil)
- }
需要特別注意的是 runtime.SetMutexProfileFraction 語句,如果未來希望進行互斥鎖的采集,那么需要通過調用該方法來設置采集頻率,若不設置或沒有設置大于 0 的數值,默認是不進行采集的。
接下來我們進行調用 go tool pprof 進行分析,如下:
- $ go tool pprof http://localhost:6061/debug/pprof/mutex
- Fetching profile over HTTP from http://localhost:6061/debug/pprof/mutex
- Saved profile in /Users/eddycjy/pprof/pprof.contentions.delay.010.pb.gz
- Type: delay
- Entering interactive mode (type "help" for commands, "o" for options)
我們查看調用 top 命令,查看互斥量的排名:
- (pprof) top
- Showing nodes accounting for 653.79us, 100% of 653.79us total
- flat flat% sum% cum cum%
- 653.79us 100% 100% 653.79us 100% sync.(*Mutex).Unlock
- 0 0% 100% 653.79us 100% main.main.func1
接下來我們可以調用 list 命令,看到指定函數的代碼情況(包含特定的指標信息,例如:耗時),若函數名不明確,默認會對函數名進行模糊匹配,如下:
- (pprof) list main
- Total: 653.79us
- ROUTINE ======================== main.main.func1 in /eddycjy/main.go
- 0 653.79us (flat, cum) 100% of Total
- . . 40: go func(i int) {
- . . 41: m.Lock()
- . . 42: defer m.Unlock()
- . . 43:
- . . 44: datas[i] = struct{}{}
- . 653.79us 45: }(i)
- . . 46: }
- . . 47:
- . . 48: err := http.ListenAndServe(":6061", nil)
- . . 49: if err != nil {
- . . 50: log.Fatalf("http.ListenAndServe err: %v", err)
- (pprof)
我們可以在輸出的分析中比較準確的看到引起互斥鎖的函數在哪里,鎖開銷在哪里,在本例中是第 45 行。
Block Profiling
與 Mutex 的 runtime.SetMutexProfileFraction 相似,Block 也需要調用 runtime.SetBlockProfileRate() 進行采集量的設置,否則默認關閉,若設置的值小于等于 0 也會認為是關閉。
與上小節 Mutex 相比,主體代碼不變,僅是新增 runtime.SetBlockProfileRate() 的調用,如下:
- func init() {
- runtime.SetBlockProfileRate(1)
- ...
- }
我們查看調用 top 命令,查看阻塞情況的排名:
- $ go tool pprof http://localhost:6061/debug/pprof/block
- Fetching profile over HTTP from http://localhost:6061/debug/pprof/block
- Saved profile in /Users/eddycjy/pprof/pprof.contentions.delay.017.pb.gz
- Type: delay
- Entering interactive mode (type "help" for commands, "o" for options)
- (pprof) top
- Showing nodes accounting for 74.54ms, 100% of 74.54ms total
- flat flat% sum% cum cum%
- 74.54ms 100% 100% 74.54ms 100% sync.(*Mutex).Lock
- 0 0% 100% 74.54ms 100% main.main.func1
同樣的,我們也可以調用 list 命令查看具體的阻塞情況,執行方式和排查模式與先前概述的一致。
查看可視化界面
接下來我們繼續使用前面的示例程序,將其重新運行起來,然后在其它窗口執行下述命令:
- $ wget http://127.0.0.1:6060/debug/pprof/profile
默認需要等待 30 秒,執行完畢后可在當前目錄下發現采集的文件 profile,針對可視化界面我們有兩種方式可進行下一步分析:
方法一(推薦):該命令將在所指定的端口號運行一個 PProf 的分析用的站點。
- $ go tool pprof -http=:6001 profile
方法二:通過 web 命令將以 svg 的文件格式寫入圖形,然后在 Web 瀏覽器中將其打開。
- $ go tool pprof profile
- Type: cpu
- Time: Feb 1, 2020 at 12:09pm (CST)
- Duration: 30s, Total samples = 60ms ( 0.2%)
- Entering interactive mode (type "help" for commands, "o" for options)
- (pprof) web
如果出現錯誤提示 Could not execute dot; may need to install graphviz.,那么意味著你需要安裝 graphviz組件。
另外方法一所運行的站點,實際上包含了方法二的內容(svg圖片),并且更靈活,因此非特殊情況,我們會直接使用方法一的方式運行站點來做觀察和分析。
剖析內容
通過 PProf 所提供的可視化界面,我們能夠更方便、更直觀的看到 Go 應用程序的調用鏈、使用情況等。另外在 View 菜單欄中,PProf 還支持多種分析方式的切換,如下:
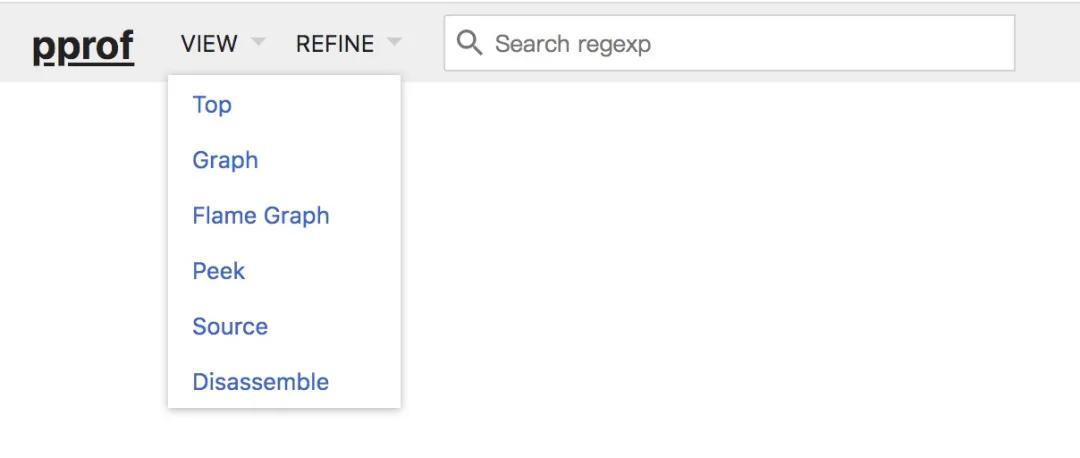
view 菜單欄
接下來我們將基于 CPU Profiling 所抓取的 Profile 進行一一介紹,而其它 Profile 類型的分析模式也是互通的,只要我們了解了一種,其余的也就會了。
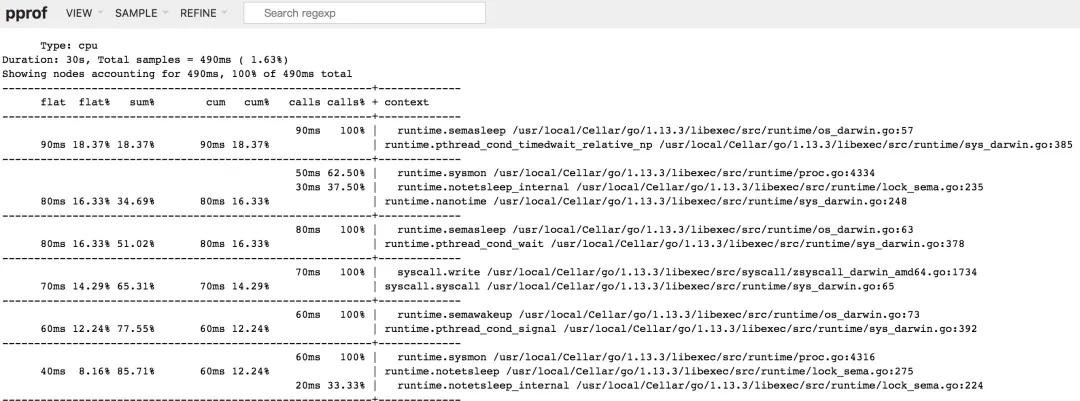
Top
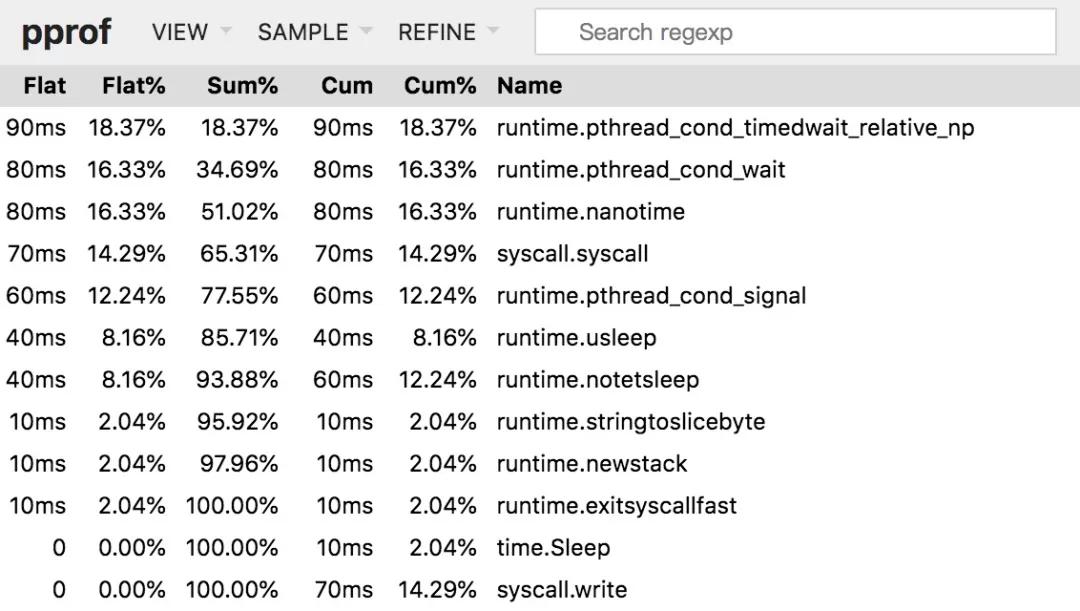
top 欄目
該視圖與前面所講解的 top 子命令的作用和含義是一樣的,因此不再贅述。
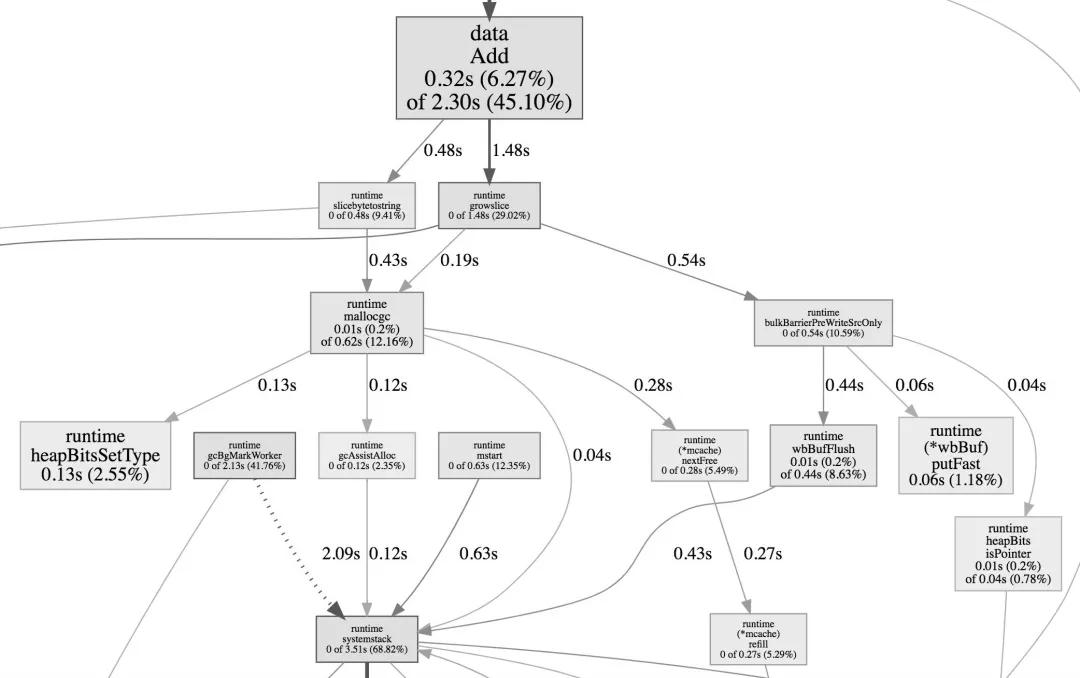
Graph
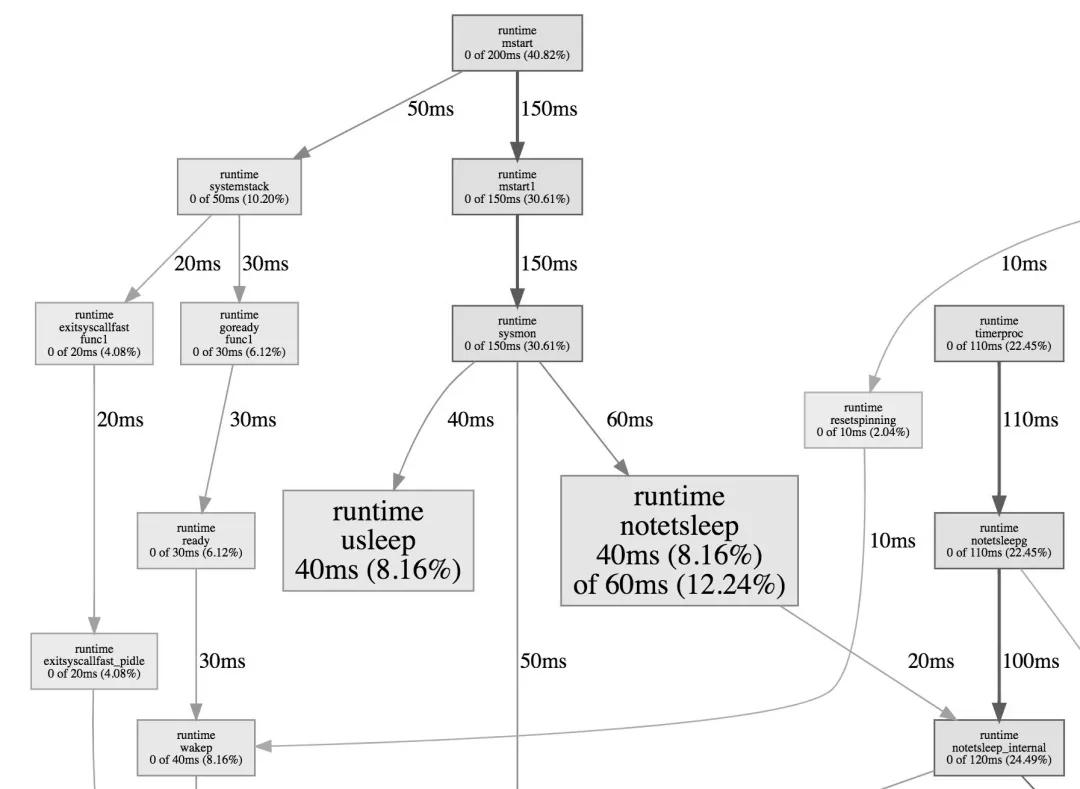
graph 欄目
該視圖展示的為整體的函數調用流程,框越大、線越粗、框顏色越鮮艷(紅色)就代表它占用的時間越久,開銷越大。相反若框顏色越淡,越小則代表在整體的函數調用流程中,它的開銷是相對較小的。
因此我們可以用此視圖去分析誰才是開銷大頭,它又是因為什么調用流程而被調用的。
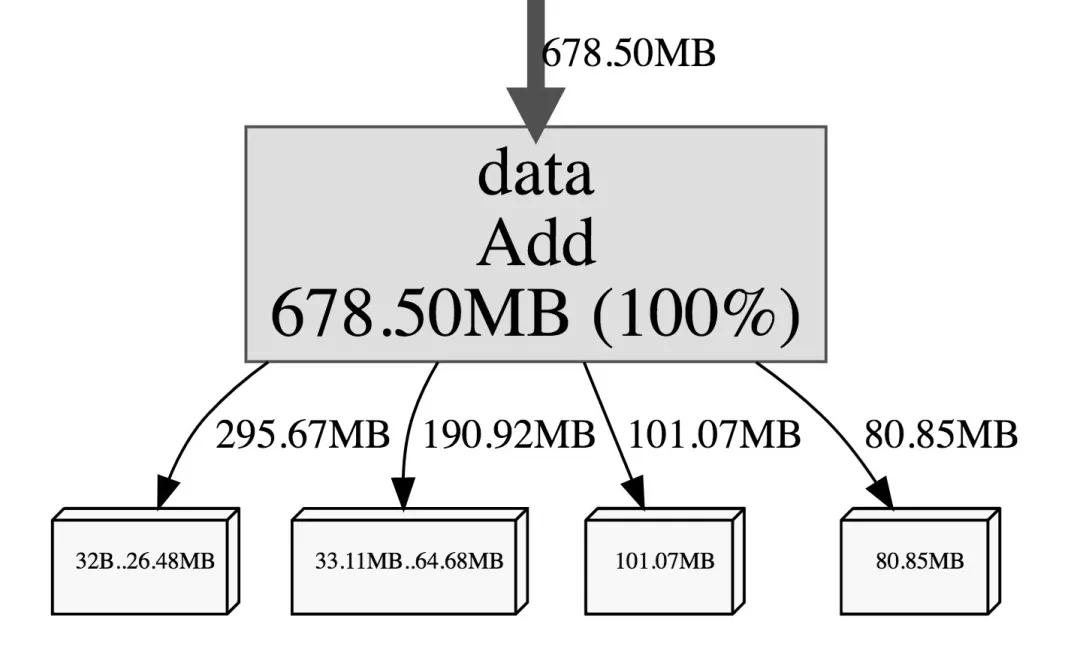
Peek
peek 欄目
此視圖相較于 Top 視圖,增加了所屬的上下文信息的展示,也就是函數的輸出調用者/被調用者。
Source
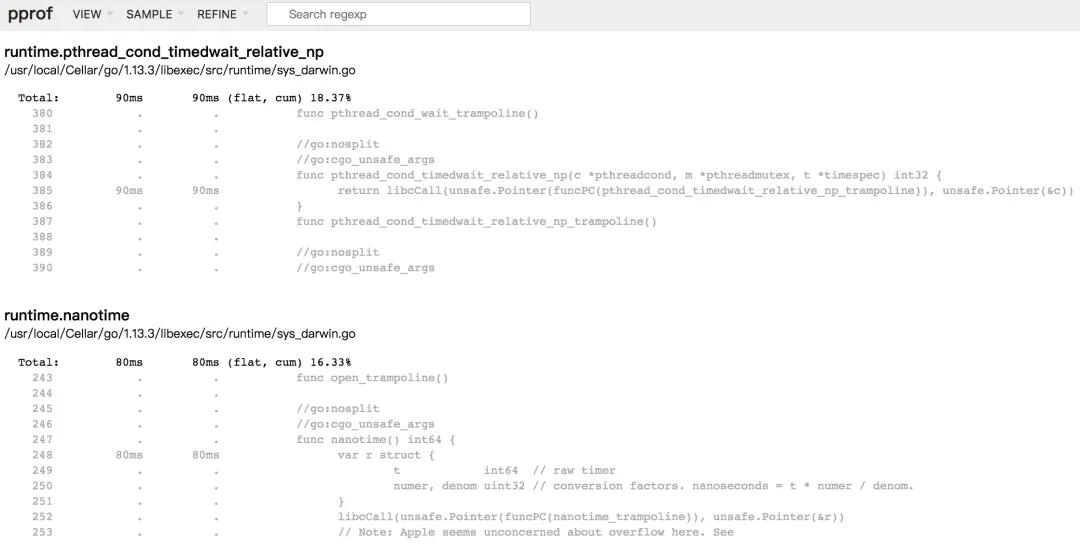
source 欄目
該視圖主要是增加了面向源代碼的追蹤和分析,可以看到其開銷主要消耗在哪里。
Flame Graph
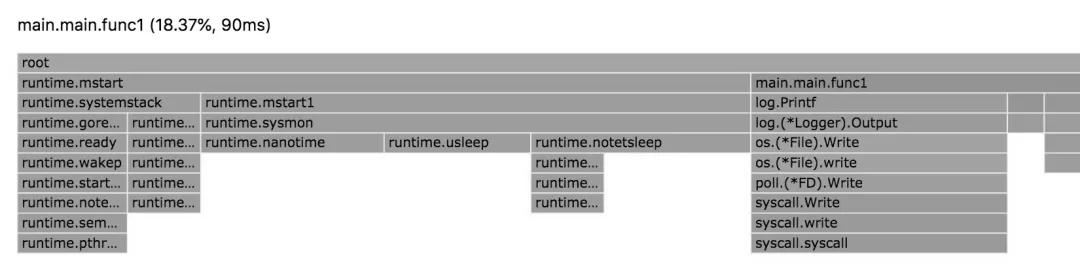
flame graph 概覽
Flame Graph(火焰圖)它是可動態的,調用順序由上到下(A -> B -> C -> D),每一塊代表一個函數、顏色越鮮艷(紅)、區塊越大代表占用 CPU 的時間更長。同時它也支持點擊塊深入進行分析。
我們選擇頁面上的 main.main.func1 區塊,將會進入到其屬下的下一層級,如下:
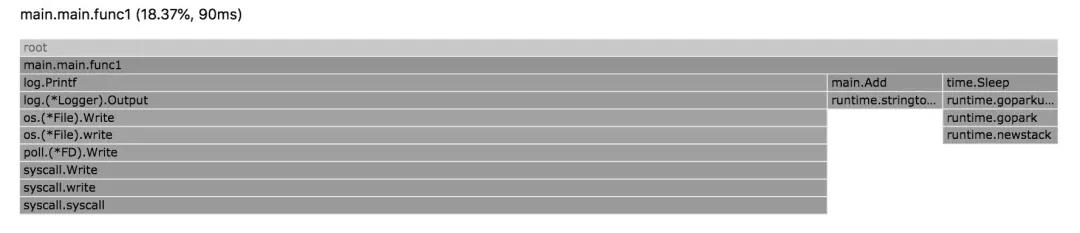
進一步查看 flame graph
這樣子我們就可以根據不同函數的多維度層級進行分析,能夠更好的觀察其流轉并發現問題。
通過測試用例做剖析
在上述章節中,我們是通過在應用程序中埋入方法進行采集的,那么還有一種方式,能夠更精準的剖析到你所想要分析的流程或函數。
首先我們將先前所編寫的 Add 方法挪到獨立的 package 中,命名為 add.go 文件,然后新建 add_test.go 文件,寫入如下測試用例代碼:
- func TestAdd(t *testing.T) {
- _ = Add("go-programming-tour-book")
- }
- func BenchmarkAdd(b *testing.B) {
- for i := 0; i < b.N; i++ {
- Add("go-programming-tour-book")
- }
- }
在完成代碼編寫后,我們回到命令行窗口執行如下采集命令:
- $ go test -bench=. -cpuprofile=cpu.profile
執行完畢后會在當前命令生成 cpu.profile 文件,然后只需執行 go tool pprof 命令就可以進行查看了,如下圖:
cpu profile
另外除了對 CPU 進行剖析以外,我們還可以調整選項,對內存情況進行分析,如下采集命令:
- $ go test -bench=. -memprofile=mem.profile
接下來和上面一樣,執行 go tool pprof 命令進行查看,如下圖:
進一步查看
通過 Lookup 寫入文件做剖析
除了注入 http handler 和 go test 以外,我們還可以在程序中通過 pprof 所提供的 Lookup 方法來進行相關內容的采集和調用。
其一共支持六種類型,分別是:
- goroutine。
- threadcreate。
- heap。
- block。
- mutex。
具體代碼如下:
- type LookupType int8
- const (
- LookupGoroutine LookupType = iota
- LookupThreadcreate
- LookupHeap
- LookupAllocs
- LookupBlock
- LookupMutex
- )
- func pprofLookup(lookupType LookupType, w io.Writer) error {
- var err error
- switch lookupType {
- case LookupGoroutine:
- p := pprof.Lookup("goroutine")
- err = p.WriteTo(w, 2)
- case LookupThreadcreate:
- p := pprof.Lookup("threadcreate")
- err = p.WriteTo(w, 2)
- case LookupHeap:
- p := pprof.Lookup("heap")
- err = p.WriteTo(w, 2)
- case LookupAllocs:
- p := pprof.Lookup("allocs")
- err = p.WriteTo(w, 2)
- case LookupBlock:
- p := pprof.Lookup("block")
- err = p.WriteTo(w, 2)
- case LookupMutex:
- p := pprof.Lookup("mutex")
- err = p.WriteTo(w, 2)
- }
- return err
- }
接下來我們只需要對該方法進行調用就好了,其提供了 io.Writer 接口,也就是只要實現了對應的 Write 方法,我們可以將其寫到任何支持地方去,如下:
- ...
- func init() {
- runtime.SetMutexProfileFraction(1)
- runtime.SetBlockProfileRate(1)
- }
- func main() {
- http.HandleFunc("/lookup/heap", func(w http.ResponseWriter, r *http.Request) {
- _ = pprofLookup(LookupHeap, os.Stdout)
- })
- http.HandleFunc("/lookup/threadcreate", func(w http.ResponseWriter, r *http.Request) {
- _ = pprofLookup(LookupThreadcreate, os.Stdout)
- })
- http.HandleFunc("/lookup/block", func(w http.ResponseWriter, r *http.Request) {
- _ = pprofLookup(LookupBlock, os.Stdout)
- })
- http.HandleFunc("/lookup/goroutine", func(w http.ResponseWriter, r *http.Request) {
- _ = pprofLookup(LookupGoroutine, os.Stdout)
- })
- _ = http.ListenAndServe("0.0.0.0:6060", nil)
- }
在上述代碼中,我們將采集結果寫入到了控制臺上,我們可以進行一下驗證,調用 http://127.0.0.1:6060/lookup/heap,控制臺輸出結果如下:
- $ go run main.go
- heap profile: 0: 0 [0: 0] @ heap/1048576
- # runtime.MemStats
- # Alloc = 180632
- # TotalAlloc = 180632
- # Sys = 69928960
- # Lookups = 0
- ...
為什么要初始化net/http/pprof
在我們的例子中,你會發現我們在引用上對 net/http/pprof 包進行了默認的初始化(也就是 _),如果你曾經漏了,或者沒加,你會發現壓根調用不了 pprof 的相關接口,這是為什么呢,我們一起看看下面該包的初始化方法,如下:
- func init() {
- http.HandleFunc("/debug/pprof/", Index)
- http.HandleFunc("/debug/pprof/cmdline", Cmdline)
- http.HandleFunc("/debug/pprof/profile", Profile)
- http.HandleFunc("/debug/pprof/symbol", Symbol)
- http.HandleFunc("/debug/pprof/trace", Trace)
- }
實際上 net/http/pprof 會在初始化函數中對標準庫中 net/http 所默認提供的 DefaultServeMux 進行路由注冊,源碼如下:
- var DefaultServeMux = &defaultServeMux
- var defaultServeMux ServeMux
- func HandleFunc(pattern string, handler func(ResponseWriter, *Request)) {
- DefaultServeMux.HandleFunc(pattern, handler)
- }
而我們在例子中使用的 HTTP Server,也是使用的標準庫中默認提供的,因此便完美的結合在了一起,這也恰好也是最小示例的模式。
這時候你可能會注意到另外一個問題,那就是我們的實際項目中,都是有相對獨立的 ServeMux 的,這時候我們只要仿照著將 pprof 對應的路由注冊進去就好了,如下:
- mux := http.NewServeMux()
- mux.HandleFunc("/debug/pprof/", pprof.Index)
- mux.HandleFunc("/debug/pprof/cmdline", pprof.Cmdline)
- mux.HandleFunc("/debug/pprof/profile", pprof.Profile)
- mux.HandleFunc("/debug/pprof/symbol", pprof.Symbol)
- mux.HandleFunc("/debug/pprof/trace", pprof.Trace)
總結
在本文中我們詳細的介紹了 Go 語言中 pprof 的使用,針對一些常用的套件均進行了說明。而 pprof 在我們平時的性能剖析,問題排查上都占據著非常重要的角色。
在日常只需要根據合理的排查思路,相信你一定能夠根據在 pprof 中的蛛絲馬跡,解決那些或大或小的問題,實現準點下班!