Prometheus Operator自定義監控項
Prometheus Operator默認的監控指標并不能完全滿足實際的監控需求,這時候就需要我們自己根據業務添加自定義監控。添加一個自定義監控的步驟如下:
1、創建一個ServiceMonitor對象,用于Prometheus添加監控項
2、為ServiceMonitor對象關聯metrics數據接口的Service對象
3、確保Services對象可以正確獲取到metrics數據
下面本文將以如何添加redis監控為例
部署redis
k8s-redis-and-exporter-deployment.yaml
- ---
- apiVersion: v1
- kind: Namespace
- metadata:
- name: redis
- ---
- apiVersion: apps/v1
- kind: Deployment
- metadata:
- namespace: redis
- name: redis
- spec:
- replicas: 1
- selector:
- matchLabels:
- app: redis
- template:
- metadata:
- annotations:
- prometheus.io/scrape: "true"
- prometheus.io/port: "9121"
- labels:
- app: redis
- spec:
- containers:
- - name: redis
- image: redis
- resources:
- requests:
- cpu: 100m
- memory: 100Mi
- ports:
- - containerPort: 6379
- - name: redis-exporter
- image: oliver006/redis_exporter:latest
- resources:
- requests:
- cpu: 100m
- memory: 100Mi
- ports:
- - containerPort: 9121
部署redis的同時,我們把redis_exporter以sidecar的形式和redis服務部署在用一個Pod
另外注意,我們添加了annotations:prometheus.io/scrape: "true" 和 prometheus.io/port: "9121"
創建 Redis Service
- apiVersion: v1
- kind: Service
- metadata:
- name: redis-svc
- namespace: redis
- labels:
- app: redis
- spec:
- type: NodePort
- ports:
- - name: redis
- port: 6379
- targetPort: 6379
- - name: redis-exporter
- port: 9121
- targetPort: 9121
- selector:
- app: redis
檢查下部署好的服務并驗證metrics能夠獲取到數據
- [root@]# kubectl get po,ep,svc -n redis
- NAME READY STATUS RESTARTS AGE
- pod/redis-78446485d8-sp57x 2/2 Running 0 116m
- NAME ENDPOINTS AGE
- endpoints/redis-svc 100.102.126.3:9121,100.102.126.3:6379 6m5s
- NAME TYPE CLUSTER-IP EXTERNAL-IP PORT(S) AGE
- service/redis-svc NodePort 10.105.111.177 <none> 6379:32357/TCP,9121:31019/TCP 6m5s
- 驗證metrics
- [root@qd01-stop-k8s-master001 MyDefine]# curl 10.105.111.177:9121/metrics
- # HELP go_gc_duration_seconds A summary of the pause duration of garbage collection cycles.
- # TYPE go_gc_duration_seconds summary
- go_gc_duration_seconds{quantile="0"} 0
- go_gc_duration_seconds{quantile="0.25"} 0
- go_gc_duration_seconds{quantile="0.5"} 0
- go_gc_duration_seconds{quantile="0.75"} 0
- go_gc_duration_seconds{quantile="1"} 0
- go_gc_duration_seconds_sum 0
- go_gc_duration_seconds_count 0
- # HELP go_goroutines Number of goroutines that currently exist.
- # TYPE go_goroutines gauge
- go_goroutines 8
- # HELP go_info Information about the Go environment.
- # TYPE go_info gauge
- ............
創建 ServiceMonitor
現在 Prometheus 訪問redis,接下來創建 ServiceMonitor 對象即可
- apiVersion: monitoring.coreos.com/v1
- kind: ServiceMonitor
- metadata:
- name: redis-k8s
- namespace: monitoring
- labels:
- app: redis
- spec:
- jobLabel: redis
- endpoints:
- - port: redis-exporter
- interval: 30s
- scheme: http
- selector:
- matchLabels:
- app: redis
- namespaceSelector:
- matchNames:
- - redis
執行創建并查看-serviceMonitor
- [root@]# kubectl apply -f prometheus-serviceMonitorRedis.yaml
- servicemonitor.monitoring.coreos.com/redis-k8s created
- [root@]# kubectl get serviceMonitor -n monitoring
- NAME AGE
- redis-k8s 11s
現在切換到PrometheusUI界面查看targets,會發現多了剛才創建的redis-k8s監控項
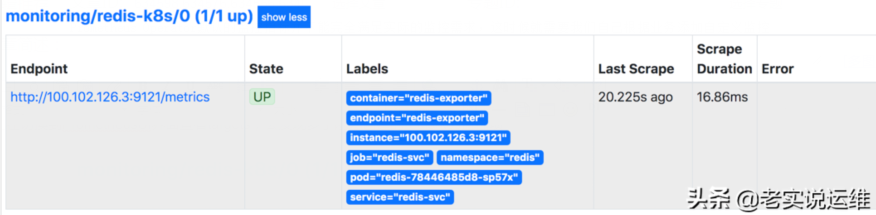
現在就可以查詢redis-exporter收集到的redis監控指標了

配置 PrometheusRule
我們現在能收集到redis的監控指標了,但是現在并沒有配置監控報警規則。需要我們自己根據實際關心的指標添加報警規則
首先我們看下Prometheus默認的規則,大概如下。
現在我們就來為redis添加一條規則,在 Prometheus的 Config 頁面下面查看關于 AlertManager 的配置:
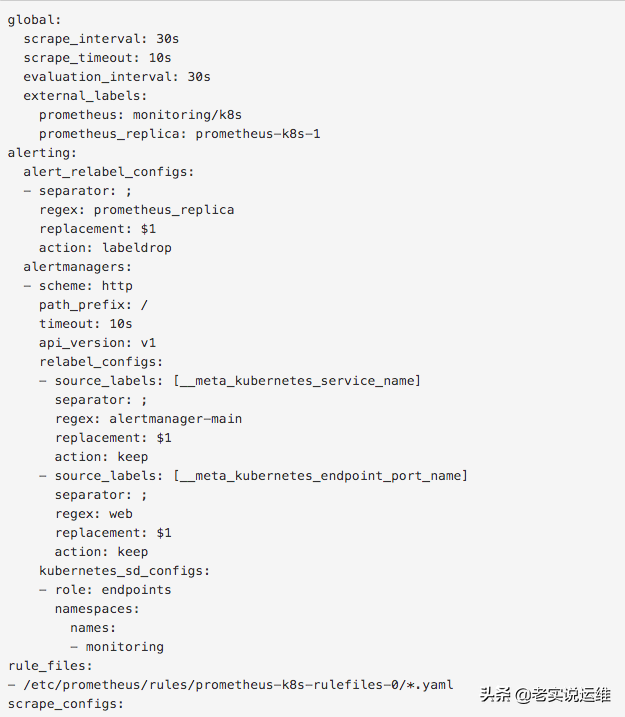
上面 alertmanagers 實例的配置我們可以看到是通過角色為 endpoints 的 kubernetes 的服務發現機制獲取的,匹配的是服務名為 alertmanager-main,端口名為 web 的 Service 服務,我們查看下 alertmanager-main 這個 Service:
- [root@]# kubectl describe svc alertmanager-main -n monitoring
- Name: alertmanager-main
- Namespace: monitoring
- Labels: alertmanager=main
- Annotations: <none>
- Selector: alertmanager=main,app=alertmanager
- Type: ClusterIP
- IP: 10.111.141.65
- Port: web 9093/TCP
- TargetPort: web/TCP
- Endpoints: 100.118.246.1:9093,100.64.147.129:9093,100.98.81.194:9093
- Session Affinity: ClientIP
- Events: <none>
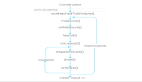
可以看到服務名就是 alertmanager-main,Port 定義的名稱也是 web,符合上面的規則,所以 Prometheus 和 AlertManager 組件就正確關聯上了。而對應的報警規則文件位于:/etc/prometheus/rules/prometheus-k8s-rulefiles-0/目錄下面所有的 YAML 文件。可以進入 Prometheus 的 Pod 中驗證下該目錄下面是否有 YAML 文件:

這個YAML文件實際上就是我們之前創建的一個 PrometheusRule 文件包含的:
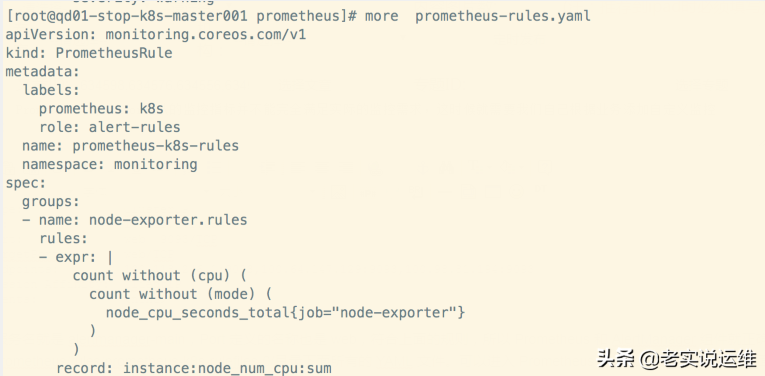
這里的 PrometheusRule 的 name 為 prometheus-k8s-rules,namespace 為 monitoring,我們可以猜想到我們創建一個 PrometheusRule 資源對象后,會自動在上面的 prometheus-k8s-rulefiles-0 目錄下面生成一個對應的-.yaml文件,所以如果以后我們需要自定義一個報警選項的話,只需要定義一個 PrometheusRule 資源對象即可。至于為什么 Prometheus 能夠識別這個 PrometheusRule 資源對象呢?這就查看我們創建的 prometheus( prometheus-prometheus.yaml) 這個資源對象了,里面有非常重要的一個屬性 ruleSelector,用來匹配 rule 規則的過濾器,要求匹配具有 prometheus=k8s 和 role=alert-rules 標簽的 PrometheusRule 資源對象,現在明白了吧?
- ruleSelector:
- matchLabels:
- prometheus: k8s
- role: alert-rules
所以要想自定義一個報警規則,只需要創建一個具有 prometheus=k8s 和 role=alert-rules 標簽的 PrometheusRule 對象就行了,比如現在我們添加一個redis是否可用的報警,我們可以通過redis_up這個指標檢查redis是否啟動,創建文件 prometheus-redisRules.yaml:
- apiVersion: monitoring.coreos.com/v1
- kind: PrometheusRule
- metadata:
- labels:
- prometheus: k8s
- role: alert-rules
- name: redis-rules
- namespace: monitoring
- spec:
- groups:
- - name: redis
- rules:
- - alert: RedisUnavailable
- annotations:
- summary: redis instance info
- description: If redis_up == 0, redis will be unavailable
- expr: |
- redis_up == 0
- for: 3m
- labels:
- severity: critical
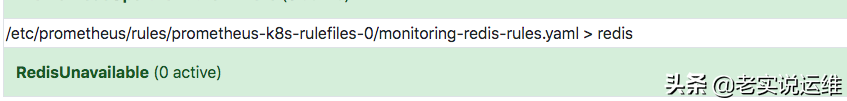
創建prometheusrule后,可以看到我們自己創建的redis-rules
- kubectl apply -f prometheus-redisRules.yaml
- kubectl get prometheusrule -n monitoring
- NAME AGE
- etcd-rules 4d18h
- prometheus-k8s-rules 17d
- redis-rules 15s
注意 label 標簽一定至少要有 prometheus=k8s 或 role=alert-rules,創建完成后,隔一會兒再去容器中查看下 rules 文件夾:
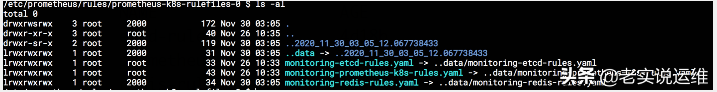
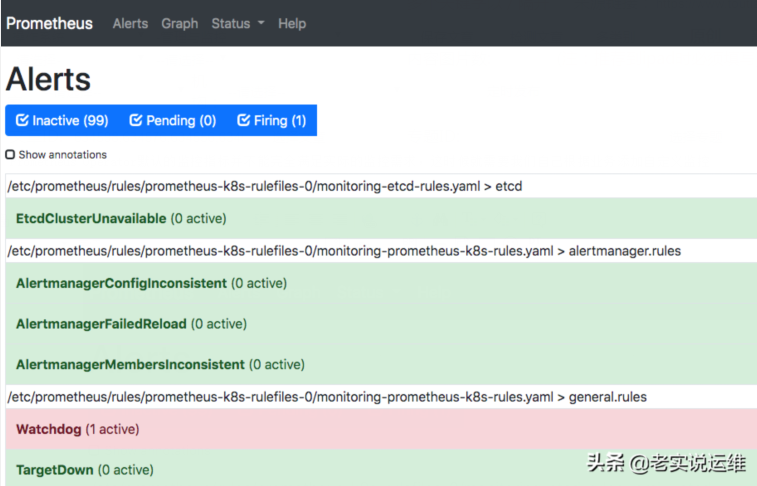
現在看到我們創建的 rule 文件已經被注入到了對應的 rulefiles 文件夾下面了。然后再去 Prometheus的 Alert 頁面下面就可以查看到上面我們新建的報警規則了:
配置報警
現在我們知道了怎么去添加一個報警規則配置項,但是這些報警信息用怎樣的方式去發送呢?
這個就需要我們配置alertmanager
這里我以郵件和微信為例
alertmanager的配置文件alertmanager.yaml使用 alertmanager-secret.yaml 文件創建,這里看下默認的配置
cat alertmanager-secret.yaml
- apiVersion: v1
- kind: Secret
- metadata:
- name: alertmanager-main
- namespace: monitoring
- stringData:
- alertmanager.yaml: |-
- "global":
- "resolve_timeout": "5m"
- "inhibit_rules":
- - "equal":
- - "namespace"
- - "alertname"
- "source_match":
- "severity": "critical"
- "target_match_re":
- "severity": "warning|info"
- - "equal":
- - "namespace"
- - "alertname"
- "source_match":
- "severity": "warning"
- "target_match_re":
- "severity": "info"
- "receivers":
- - "name": "Default"
- - "name": "Watchdog"
- - "name": "Critical"
- "route":
- "group_by":
- - "namespace"
- "group_interval": "5m"
- "group_wait": "30s"
- "receiver": "Default"
- "repeat_interval": "12h"
- "routes":
- - "match":
- "alertname": "Watchdog"
- "receiver": "Watchdog"
- - "match":
- "severity": "critical"
- "receiver": "Critical"
- type: Opaque
現在我們需要修改這個文件,配置微信和郵件相關信息,前提你需要自行準備好企業微信相關信息,可以自行網上搜相關教程。
首先創建alertmanager.yaml文件
- global:
- resolve_timeout: 5m
- smtp_smarthost: 'smtp.51os.club:25'
- smtp_from: 'amos'
- smtp_auth_username: 'amos@51os.club'
- smtp_auth_password: 'Mypassword'
- smtp_hello: '51os.club'
- smtp_require_tls: false
- wechat_api_url: 'https://qyapi.weixin.qq.com/cgi-bin/'
- wechat_api_secret: 'SGGc4x-RDcVD_ptvVhYrxxxxxxxxxxOhWVWIITRxM'
- wechat_api_corp_id: 'ww419xxxxxxxx735e1c0'
- templates:
- - '*.tmpl'
- route:
- group_by: ['job', 'severity']
- group_wait: 30s
- group_interval: 5m
- repeat_interval: 12h
- receiver: default
- routes:
- - receiver: wechat
- continue: true
- match:
- alertname: Watchdog
- receivers:
- - name: 'default'
- email_configs:
- - to: '10xxxx1648@qq.com'
- send_resolved: true
- - name: 'wechat'
- wechat_configs:
- - send_resolved: false
- corp_id: 'ww419xxxxxxxx35e1c0'
- to_party: '13'
- message: '{{ template "wechat.default.message" . }}'
- agent_id: '1000003'
- api_secret: 'SGGc4x-RDcxxxxxxxxY6YwfZFsO9OhWVWIITRxM'
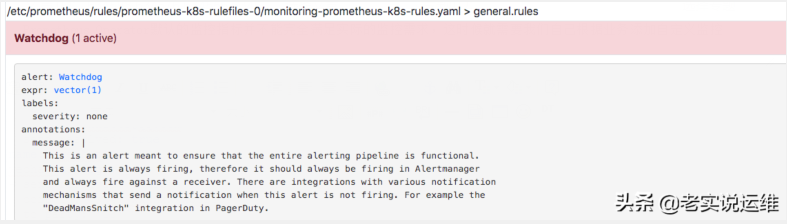
我這里添加了兩個接收器,默認的通過郵箱進行發送,對于 Watchdog 這個報警我們通過 webhook 來進行發送,這個 webhook 就是wechat。
說明我這里偷懶,因為現在系統剛好有一個報警Watchdog,所以我這里匹配了 Watchdog 這個報警,當然您可以換成我們自定義的redis的監控RedisUnavailable
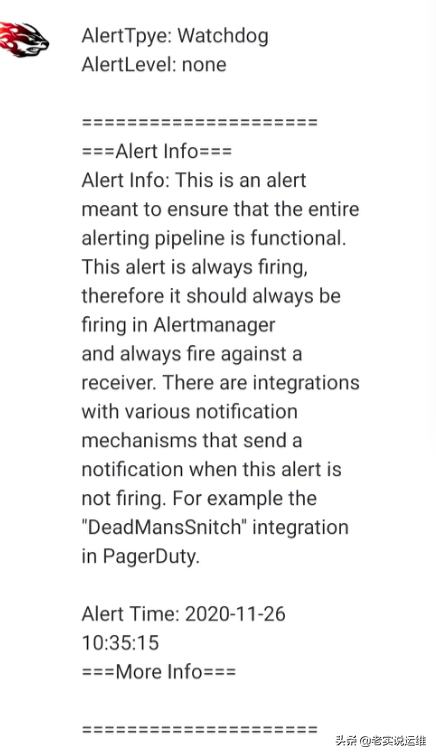
然后使用在創建一個templates文件,這個文件是發微信消息的模板wechat.tmpl:
- {{ define "wechat.default.message" }}
- {{- if gt (len .Alerts.Firing) 0 -}}
- {{- range $index, $alert := .Alerts -}}
- {{- if eq $index 0 -}}
- AlertTpye: {{ $alert.Labels.alertname }}
- AlertLevel: {{ $alert.Labels.severity }}
- =====================
- {{- end }}
- ===Alert Info===
- Alert Info: {{ $alert.Annotations.message }}
- Alert Time: {{ $alert.StartsAt.Format "2006-01-02 15:04:05" }}
- ===More Info===
- {{ if gt (len $alert.Labels.instance) 0 -}}InstanceIp: {{ $alert.Labels.instance }};{{- end -}}
- {{- if gt (len $alert.Labels.namespace) 0 -}}InstanceNamespace: {{ $alert.Labels.namespace }};{{- end -}}
- {{- if gt (len $alert.Labels.node) 0 -}}NodeIP: {{ $alert.Labels.node }};{{- end -}}
- {{- if gt (len $alert.Labels.pod_name) 0 -}}PodName: {{ $alert.Labels.pod_name }}{{- end }}
- =====================
- {{- end }}
- {{- end }}
- {{- if gt (len .Alerts.Resolved) 0 -}}
- {{- range $index, $alert := .Alerts -}}
- {{- if eq $index 0 -}}
- AlertTpye: {{ $alert.Labels.alertname }}
- AlertLevel: {{ $alert.Labels.severity }}
- =====================
- {{- end }}
- ===Alert Info===
- Alert Info: {{ $alert.Annotations.message }}
- Alert Start Time: {{ $alert.StartsAt.Format "2006-01-02 15:04:05" }}
- Alert Fix Time: {{ $alert.EndsAt.Format "2006-01-02 15:04:05" }}
- ===More Info===
- {{ if gt (len $alert.Labels.instance) 0 -}}InstanceIp: {{ $alert.Labels.instance }};{{- end -}}
- {{- if gt (len $alert.Labels.namespace) 0 -}}InstanceNamespace: {{ $alert.Labels.namespace }};{{- end -}}
- {{- if gt (len $alert.Labels.node) 0 -}}NodeIP: {{ $alert.Labels.node }};{{- end -}}
- {{- if gt (len $alert.Labels.pod_name) 0 -}}PodName: {{ $alert.Labels.pod_name }};{{- end }}
- =====================
- {{- end }}
- {{- end }}
- {{- end }}
現在我們先刪除原來的 alertmanager-main secret,然后再基于alertmanager.yaml和wechat.tmpl創建alertmanager-main secret
- kubectl delete secret alertmanager-main -n monitoring
- kubectl create secret generic alertmanager-main --from-file=alertmanager.yaml --from-file=wechat.tmpl -n monitoring
上面的步驟創建完成后,很快我們就會收到一條wechat消息,同樣郵箱中也會收到報警信息:
再次查看 AlertManager 的配置信息可以看到已經變成上面我們的配置信息了