Matplotlib繪圖雙縱坐標(biāo)軸設(shè)置及控制設(shè)置時(shí)間格式
雙y軸坐標(biāo)軸圖
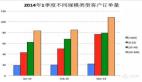
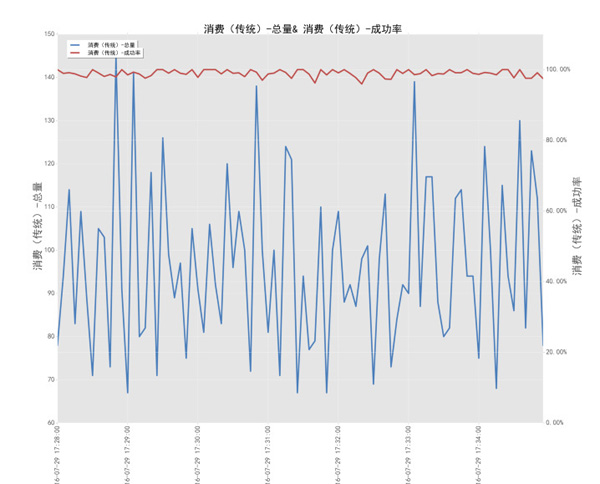
今天利用matplotlib繪圖,想要完成一個(gè)雙坐標(biāo)格式的圖。
- fig=plt.figure(figsize=(20,15))
- ax1=fig.add_subplot(111)
- ax1.plot(demo0719['TPS'],'b-',label='TPS',linewidth=2)
- ax2=ax1.twinx()#這是雙坐標(biāo)關(guān)鍵一步
- ax2.plot(demo0719['successRate']*100,'r-',label='successRate',linewidth=2)
橫坐標(biāo)設(shè)置時(shí)間間隔
- import matplotlib.dates as mdate
- ax1.xaxis.set_major_formatter(mdate.DateFormatter('%Y-%m-%d %H:%M:%S'))#設(shè)置時(shí)間標(biāo)簽顯示格式
- plt.xticks(pd.date_range(demo0719.index[0],demo0719.index[-1],freq='1min'))
縱坐標(biāo)設(shè)置顯示百分比
- import matplotlib.ticker as mtick
- fmt='%.2f%%'
- yticks = mtick.FormatStrFormatter(fmt)
- ax2.yaxis.set_major_formatter(yticks)
知識(shí)點(diǎn)
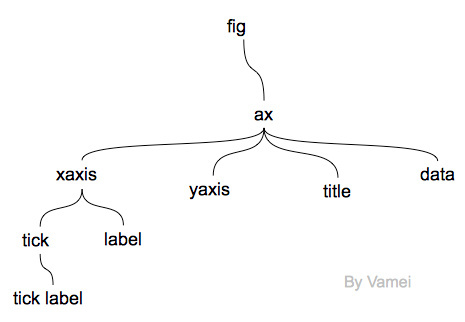
在matplotlib中,整個(gè)圖像為一個(gè)Figure對(duì)象。在Figure對(duì)象中可以包含一個(gè),或者多個(gè)Axes對(duì)象。每個(gè)Axes對(duì)象都是一個(gè)擁有自己坐標(biāo)系統(tǒng)的繪圖區(qū)域。其邏輯關(guān)系如下:
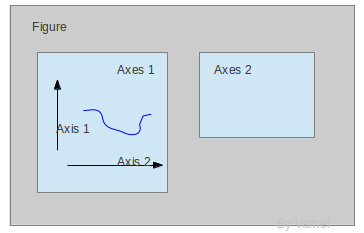
一個(gè)Figure對(duì)應(yīng)一張圖片。
Title為標(biāo)題。Axis為坐標(biāo)軸,Label為坐標(biāo)軸標(biāo)注。Tick為刻度線,Tick Label為刻度注釋。
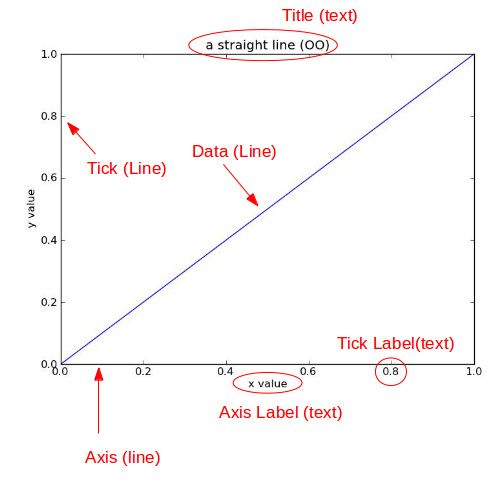
Title為標(biāo)題。Axis為坐標(biāo)軸,Label為坐標(biāo)軸標(biāo)注。Tick為刻度線,Tick Label為刻度注釋。
add_subplot()
- 官網(wǎng)matplotlib.pyplot.figure
pyplot.figure()是返回一個(gè)Figure對(duì)象的,也就是一張圖片。 - add_subplot(args, *kwargs)
The Axes instance will be returned.
twinx()
- matplotlib.axes.Axes method2
- ax = twinx()
create a twin of Axes for generating a plot with a sharex x-axis but independent y axis. The y-axis of self will have ticks on left and the returned axes will have ticks on the right.
意思就是,創(chuàng)建了一個(gè)獨(dú)立的Y軸,共享了X軸。雙坐標(biāo)軸!
類似的還有twiny()
ax1.xaxis.set_major_formatter
- set_major_formatter(formatter)
Set the formatter of the major ticker
ACCEPTS: A Formatter instance
DateFormatter()
- class matplotlib.dates.DateFormatter(fmt, tz=None)
這是一個(gè)類,創(chuàng)建一個(gè)時(shí)間格式的實(shí)例。
strftime方法(傳入格式化字符串)。
- strftime(dt, fmt=None)
- Refer to documentation for datetime.strftime.
- fmt is a strftime() format string.
FormatStrFormatter()
- class matplotlib.ticker.FormatStrFormatter(fmt)
Use a new-style format string (as used by str.format()) to format the tick. The field formatting must be labeled x
定義字符串格式。
plt.xticks
- matplotlib.pyplot.xticks(args, *kwargs)
- # return locs, labels where locs is an array of tick locations and
- # labels is an array of tick labels.
- locs, labels = xticks()
- # set the locations of the xticks
- xticks( arange(6) )
- # set the locations and labels of the xticks
- xticks( arange(5), ('Tom', 'Dick', 'Harry', 'Sally', 'Sue') )
代碼匯總
- #coding:utf-8
- import matplotlib.pyplot as plt
- import matplotlib as mpl
- import matplotlib.dates as mdate
- import matplotlib.ticker as mtick
- import numpy as np
- import pandas as pd
- import os
- mpl.rcParams['font.sans-serif']=['SimHei'] #用來(lái)正常顯示中文標(biāo)簽
- mpl.rcParams['axes.unicode_minus']=False #用來(lái)正常顯示負(fù)號(hào)
- mpl.rc('xtick', labelsize=20) #設(shè)置坐標(biāo)軸刻度顯示大小
- mpl.rc('ytick', labelsize=20)
- font_size=30
- #matplotlib.rcParams.update({'font.size': 60})
- %matplotlib inline
- plt.style.use('ggplot')
- data=pd.read_csv('simsendLogConvert_20160803094801.csv',index_col=0,encoding='gb2312',parse_dates=True)
- columns_len=len(data.columns)
- data_columns=data.columns
- for x in range(0,columns_len,2):
- print('第{}列'.format(x))
- total=data.ix[:,x]
- print('第{}列'.format(x+1))
- successRate=(data.ix[:,x+1]/data.ix[:,x]).fillna(0)
- yLeftLabel=data_columns[x]
- yRightLable=data_columns[x+1]
- print('------------------開始繪制類型{}曲線圖------------------'.format(data_columns[x]))
- fig=plt.figure(figsize=(25,20))
- ax1=fig.add_subplot(111)
- #繪制Total曲線圖
- ax1.plot(total,color='#4A7EBB',label=yLeftLabel,linewidth=4)
- # 設(shè)置X軸的坐標(biāo)刻度線顯示間隔
- ax1.xaxis.set_major_formatter(mdate.DateFormatter('%Y-%m-%d %H:%M:%S'))#設(shè)置時(shí)間標(biāo)簽顯示格式
- plt.xticks(pd.date_range(data.index[0],data.index[-1],freq='1min'))#時(shí)間間隔
- plt.xticks(rotation=90)
- #設(shè)置雙坐標(biāo)軸,右側(cè)Y軸
- ax2=ax1.twinx()
- #設(shè)置右側(cè)Y軸顯示百分?jǐn)?shù)
- fmt='%.2f%%'
- yticks = mtick.FormatStrFormatter(fmt)
- # 繪制成功率圖像
- ax2.set_ylim(0,110)
- ax2.plot(successRate*100,color='#BE4B48',label=yRightLable,linewidth=4)
- ax2.yaxis.set_major_formatter(yticks)
- ax1.set_xlabel('Time',fontsize=font_size)
- ax1.set_ylabel(yLeftLabel,fontsize=font_size)
- ax2.set_ylabel(yRightLable,fontsize=font_size)
- legend1=ax1.legend(loc=(.02,.94),fontsize=16,shadow=True)
- legend2=ax2.legend(loc=(.02,.9),fontsize=16,shadow=True)
- legend1.get_frame().set_facecolor('#FFFFFF')
- legend2.get_frame().set_facecolor('#FFFFFF')
- plt.title(yLeftLabel+'&'+yRightLable,fontsize=font_size)
- plt.savefig('D:\\JGT\\Work-YL\\01布置的任務(wù)\\04繪制曲線圖和報(bào)告文件\\0803\\出圖\\{}-{}'.format(yLeftLabel.replace(r'/',' '),yRightLable.replace(r'/',' ')),dpi=300)
參考