在使用 R 時會發生什么?
備注:本文不是一部 R 教程。下面的示例僅試圖讓您了解 R 會話看起來是什么樣的。
R 二進制文件可用于 Windows、Mac OS X 和多個 Linux® 發行版。源代碼也可供人們自行編譯。
在 Windows® 中,安裝程序將 R 添加到開始菜單中。要在 Linux 中啟動 R,可打開一個終端窗口并在提示符下鍵入 R。您應看到類似圖 1 的畫面。
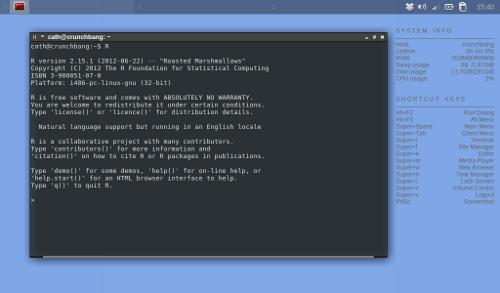
圖 1. R 工作區
在提示符下鍵入一個命令,R 就會響應。
此時,在真實的環境中,您可能會從一個外部數據文件將數據讀入 R 對象中。R 可從各種不同格式的文件讀取數據,但對于本示例,我使用的是來自 MASS 包的 michelson 數據。這個包附帶了 Venables and Ripley 的標志性文本 Modern Applied Statistics with S-Plus(參見 參考資料)。michelson 包含來自測量光速的流行的 Michelson and Morley 實驗的結果。
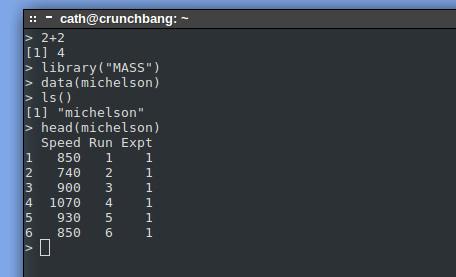
清單 1 中提供的命令可以加載 MASS 包,獲取并查看 michelson 數據。圖 2 顯示了這些命令和來自 R 的響應。每一行包含一個 R 函數,它的參數放在方括號 ([]) 內。
清單 1. 啟動一個 R 會話
    2+2             # R can be a calculator. R responds, correctly, with 4.
    library("MASS") # Loads into memory the functions and data sets from
                    # package MASS, that accompanies Modern Applied Statistics in S

    data(michelson) # Copies the michelson data set into the workspace.

    ls()            # Lists the contents of the workspace. The michelson data is there.

    head(michelson) # Displays the first few lines of this data set.
                    # Column Speed contains Michelson and Morleys estimates of the
                    # speed of light, less 299,000, in km/s.
                    # Michelson and Morley ran five experiments with 20 runs each.
                    # The data set contains indicator variables for experiment and run.
    help(michelson) # Calls a help screen, which describes the data set.
圖 2. 會話啟動和 R 的響應
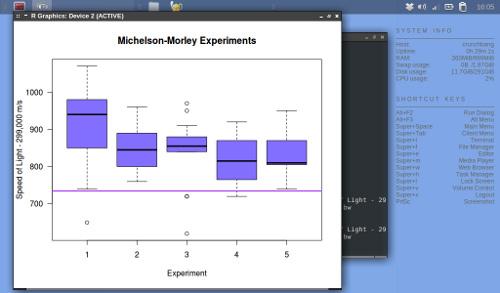
現在讓我們看看該數據(參見 清單 2)。輸出如 圖 3 中所示。
清單 2. R 中的一個箱線圖
    # Basic boxplot

    with(michelson, boxplot(Speed ~ Expt))

    # I can add colour and labels. I can also save the results to an object.

    michelson.bp = with(michelson, boxplot(Speed ~ Expt, xlab="Experiment", las=1,
                    ylab="Speed of Light - 299,000 m/s",
                    main="Michelson-Morley Experiments",
                    col="slateblue1"))

    # The current estimate of the speed of light, on this scale, is 734.***dd a horizontal line to highlight this value.

    abline(h=734.5, lwd=2,col="purple")  #Add modern speed of light
Michelson and Morley 似乎有計劃地高估了光速。各個實驗之間似乎也存在一定的不均勻性。
圖 3. 繪制一個箱線圖
在對分析感到滿意后,我可以將所有命令保存到一個 R 函數中。參見清單 3。
清單 3. R 中的一個簡單函數
    MyExample = function(){
        library(MASS)
        data(michelson)
        michelson.bw = with(michelson, boxplot(Speed ~ Expt, xlab="Experiment", las=1,
        ylab="Speed of Light - 299,000 m/s", main="Michelsen-Morley Experiments",
            col="slateblue1"))
        abline(h=734.5, lwd=2,col="purple")

    }
這個簡單示例演示了 R 的多個重要功能:
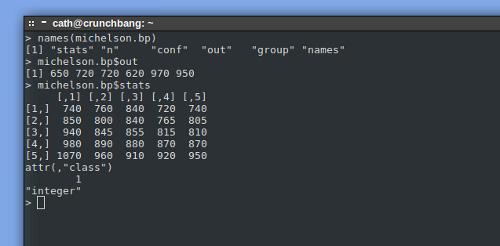
保存結果—boxplot() 函數返回一些有用的統計數據和一個圖表,您可以通過類似 michelson.bp = … 的負值語句將這些結果保存到一個 R 對象中,并在需要時提取它們。任何賦值語句的結果都可在 R 會話的整個過程中獲得,并且可以作為進一步分析的主題。boxplot 函數返回一個用于繪制箱線圖的統計數據(中位數、四分位等)矩陣、每個箱線圖中的項數,以及異常值(在 圖 3 中的圖表上顯示為開口圓)。請參見圖 4。
圖 4. 來自 boxplot 函數的統計數據
公式語言— R(和 S)有一種緊湊的語言來表達統計模型。參數中的代碼 Speed ~ Expt 告訴函數在每個 Expt (實驗數字)級別上繪制 Speed 的箱線圖。如果希望執行方差分析來測試各次實驗中的速度是否存在顯著差異,那么可以使用相同的公式:lm(Speed ~ Expt)。公式語言可表達豐富多樣的統計模型,包括交叉和嵌套效應,以及固定和隨機因素。
用戶定義的 R 函數— 這是一種編程語言。