OpenHarmony的性能調(diào)試工具Strace
作者:左翼風(fēng)發(fā)
Strace是一個強大的進程行為跟蹤工具,如何在OpenHarmony里編譯使用此工具就是我們這篇文章要分享的話題。

Strace是一個強大的進程行為跟蹤工具,當(dāng)懷疑某個進程運行異常的時候,比如死鎖,CPU高或者莫名卡頓等,可以使用strace查看該進程發(fā)起的系統(tǒng)調(diào)用和接收到的信號,從而確定問題所在。當(dāng)然也可以利用strace去學(xué)習(xí)了解進程的運行流程,調(diào)用庫以及參數(shù)和統(tǒng)計。那么如何在OpenHarmony里編譯使用此工具就是我們這篇文章要分享的話題。
編譯構(gòu)建
- 下載:從https://github.com/strace下載最新源碼
//下載地址
wget https://github.com/strace/strace/releases/download/v6.6/strace-6.6.tar.xz- 安裝編譯環(huán)境
//編譯工具鏈(32位)
sudo apt-get install gcc-arm-linux-gnueabi
//ohos的源碼下載后,其實也有對應(yīng)的工具鏈,位置如下
prebuilts/gcc/linux-x86/arm(32位)/gcc-linaro-7.5.0-arm-linux-gnueabi/bin- 編譯
//設(shè)置環(huán)境變量
export CC=arm-linux-gnueabi-gcc
export CFLAGS=-static
export CPPFLAGS=-static
export LDFLAGS='-static -pthread'
//配置
./configure CC=arm-linux-gnueabi-gcc CXX=arm-linux-gnueabi-cpp LD=arm-linux-gnueabi-ld RANLIB=arm-linux-gnueabi-ranlib --host=arm-linux --target=arm-linux --enable-mpers=no
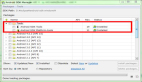
//編譯
make
//strip
arm-linux-gnueabi-strip strace- 運行測試
//傳到板子上
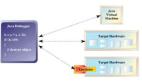
hdc_std.exe shell mount -o rw,remount /
hdc_std.exe file send strace /system/bin
hdc_std.exe shell chmod +x /system/bin/strace
//運行測試
hdc_std.exe shell
# strace --help
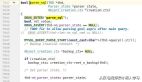
Usage: strace [-ACdffhiqqrtttTvVwxxyyzZ] [-I N] [-b execve] [-e EXPR]...
[-a COLUMN] [-o FILE] [-s STRSIZE] [-X FORMAT] [-P PATH]...
[-p PID]... [--seccomp-bpf]
{ -p PID | [-DDD] [-E VAR=VAL]... [-u USERNAME] PROG [ARGS] }
or: strace -c[dfwzZ] [-I N] [-b execve] [-e EXPR]... [-O OVERHEAD]
[-S SORTBY] [-P PATH]... [-p PID]... [--seccomp-bpf]
{ -p PID | [-DDD] [-E VAR=VAL]... [-u USERNAME] PROG [ARGS] }
General:
-e EXPR a qualifying expression: OPTION=[!]all or OPTION=[!]VAL1[,VAL2]...
options: trace, abbrev, verbose, raw, signal, read, write, fault,
inject, status, kvm
Startup:
-E VAR=VAL, --env=VAR=VAL
put VAR=VAL in the environment for command
-E VAR, --env=VAR
remove VAR from the environment for command
-p PID, --attach=PID
trace process with process id PID, may be repeated
-u USERNAME, --user=USERNAME
run command as USERNAME handling setuid and/or setgid
Tracing:
-b execve, --detach-on=execve
detach on execve syscall
-D run tracer process as a grandchild, not as a parent
-DD run tracer process in a separate process group
-DDD run tracer process in a separate session
-f follow forks
-ff follow forks with output into separate files
-I INTERRUPTIBLE
1: no signals are blocked
2: fatal signals are blocked while decoding syscall (default)
3: fatal signals are always blocked (default if '-o FILE PROG')
4: fatal signals and SIGTSTP (^Z) are always blocked
(useful to make 'strace -o FILE PROG' not stop on ^Z)
Filtering:
-e trace=[!]{[?]SYSCALL[@64|@32|@x32]|[?]/REGEX|GROUP|all|none},
--trace=[!]{[?]SYSCALL[@64|@32|@x32]|[?]/REGEX|GROUP|all|none}
trace only specified syscalls.
groups: %creds, %desc, %file, %fstat, %fstatfs %ipc, %lstat,
%memory, %net, %process, %pure, %signal, %stat, %%stat,
%statfs, %%statfs
-e signal=SET, --signal=SET
trace only the specified set of signals
print only the signals from SET
-e status=SET, --status=SET
print only system calls with the return statuses in SET
statuses: successful, failed, unfinished, unavailable, detached
-P PATH, --trace-path=PATH
trace accesses to PATH
-z print only syscalls that returned without an error code
-Z print only syscalls that returned with an error code
Output format:
-a COLUMN, --columns=COLUMN
alignment COLUMN for printing syscall results (default 40)
-e abbrev=SET, --abbrev=SET
abbreviate output for the syscalls in SET
-e verbose=SET, --verbose=SET
dereference structures for the syscall in SET
-e raw=SET, --raw=SET
print undecoded arguments for the syscalls in SET
-e read=SET, --read=SET
dump the data read from the file descriptors in SET
-e write=SET, --write=SET
dump the data written to the file descriptors in SET
-e kvm=vcpu, --kvm=vcpu
print exit reason of kvm vcpu
-i, --instruction-pointer
print instruction pointer at time of syscall
-o FILE, --output=FILE
send trace output to FILE instead of stderr
-A, --output-append-mode
open the file provided in the -o option in append mode
-q suppress messages about attaching, detaching, etc.
-qq suppress messages about process exit status as well.
-r print relative timestamp
-s STRSIZE, --string-limit=STRSIZE
limit length of print strings to STRSIZE chars (default 32)
-t print absolute timestamp
-tt print absolute timestamp with usecs
-ttt print absolute UNIX time with usecs
-T print time spent in each syscall
-v, --no-abbrev
verbose mode: print entities unabbreviated
-x print non-ascii strings in hex
-xx print all strings in hex
-X FORMAT set the FORMAT for printing of named constants and flags
formats: raw, abbrev, verbose
-y print paths associated with file descriptor arguments
-yy print protocol specific information associated with socket
file descriptors
Statistics:
-c, --summary-only
count time, calls, and errors for each syscall and report
summary
-C, --summary like -c, but also print the regular output
-O OVERHEAD set overhead for tracing syscalls to OVERHEAD usecs
-S SORTBY, --summary-sort-by=SORTBY
sort syscall counts by: time, calls, errors, name, nothing
(default time)
-w summarise syscall latency (default is system time)
Tampering:
-e inject=SET[:error=ERRNO|:retval=VALUE][:signal=SIG][:syscall=SYSCALL]
[:delay_enter=DELAY][:delay_exit=DELAY][:when=WHEN],
--inject=SET[:error=ERRNO|:retval=VALUE][:signal=SIG][:syscall=SYSCALL]
[:delay_enter=DELAY][:delay_exit=DELAY][:when=WHEN]
perform syscall tampering for the syscalls in SET
delay: milliseconds or NUMBER{s|ms|us|ns}
when: FIRST, FIRST+, or FIRST+STEP
-e fault=SET[:error=ERRNO][:when=WHEN], --fault=SET[:error=ERRNO][:when=WHEN]
synonym for -e inject with default ERRNO set to ENOSYS.
Miscellaneous:
-d, --debug enable debug output to stderr
-h, --help print help message
--seccomp-bpf enable seccomp-bpf filtering
-V, --version print version小結(jié)
簡單說說strace的典型場景:
進程統(tǒng)計:針對某個運行高cpu消耗的進程,進行監(jiān)控統(tǒng)計,什么操作耗時多?后臺在做什么事?統(tǒng)計出來高消耗的系統(tǒng)操作
# top
Tasks: 243 total,   2 running, 237 sleeping,   0 stopped,   4 zombie
  Mem:  1992724K total,  1501188K used,   491536K free,   1830912 buffers
 Swap:  1048572K total,         0 used,  1048572K free,   683260K cached
400%cpu 125%user   1%nice  70%sys 202%idle   0%iow   0%irq   2%sirq   0%host
  PID USER         PR  NI VIRT  RES  SHR S[%CPU] %MEM     TIME+ ARGS
  555 graphics     -2  -8 150M  62M  45M S 72.4   3.1 895:19.80 render_service
  539 composer_ho+ -2  -8  17M 4.9M 3.8M S 23.2   0.2 282:37.59 composer_host           9 composer_host -8 1
  247 logd         20   0  16M 4.9M 2.3M S 12.2   0.2 167:45.62 hilogd
14516 root          0 -20    0    0    0 I  3.3   0.0   0:07.05 [kworker/u9:1-kbase_pm_poweroff_wait]
14587 root         25   5  14M 3.0M 2.6M R  2.9   0.1   0:00.12 top
  178 root         RT   0    0    0    0 S  2.3   0.0  36:26.03 [sugov:0]


# strace -cp 555
strace: Process 555 attached
strace: Process 555 detached
% time     seconds  usecs/call     calls    errors syscall
------ ----------- ----------- --------- --------- ----------------
 22.34    0.456649          22     20705           clock_gettime64
 20.30    0.415126          66      6201           ioctl
 16.03    0.327786          45      7236           writev
 10.87    0.222298          31      7006           close
  7.24    0.148065          18      7855           gettid
  5.90    0.120715          58      2058       168 futex
  3.65    0.074596          22      3296           dup
  2.76    0.056384          68       825           munmap
  2.27    0.046345          55       828           write
  1.93    0.039523          27      1442           poll
  1.64    0.033546          40       824           mmap2
  1.49    0.030400          36       828           fcntl64
  1.40    0.028689          34       824           prctl
  0.80    0.016341          36       447       206 read
  0.50    0.010236          24       412           _llseek
  0.46    0.009408          45       207           madvise
  0.36    0.007341          35       206           epoll_pwait
  0.05    0.001017        1017         1           restart_syscall
------ ----------- ----------- --------- --------- ----------------
100.00    2.044465                 61201       374 total
跟進分析:通過「T」選項可以獲取操作實際消耗的時間,通過「e」選項可以跟蹤某個操作
# strace -T -e clock_gettime64 -p 555
strace: Process 555 attached
clock_gettime64(CLOCK_MONOTONIC, {tv_sec=89616, tv_nsec=627412894}) = 0 <0.000037>
clock_gettime64(CLOCK_MONOTONIC, {tv_sec=89616, tv_nsec=627777769}) = 0 <0.000149>
clock_gettime64(CLOCK_REALTIME, {tv_sec=1702433139, tv_nsec=94341493}) = 0 <0.000047>
clock_gettime64(CLOCK_MONOTONIC, {tv_sec=89616, tv_nsec=628287311}) = 0 <0.000042>
clock_gettime64(CLOCK_MONOTONIC, {tv_sec=89616, tv_nsec=628442478}) = 0 <0.000038>
clock_gettime64(CLOCK_MONOTONIC, {tv_sec=89616, tv_nsec=628586853}) = 0 <0.000039>
clock_gettime64(CLOCK_MONOTONIC, {tv_sec=89616, tv_nsec=628774978}) = 0 <0.000037>
clock_gettime64(CLOCK_MONOTONIC, {tv_sec=89616, tv_nsec=629033978}) = 0 <0.000039>
clock_gettime64(CLOCK_MONOTONIC, {tv_sec=89616, tv_nsec=629318936}) = 0 <0.000041>
clock_gettime64(CLOCK_MONOTONIC, {tv_sec=89616, tv_nsec=629491020}) = 0 <0.000039>
這就是一個最簡單的查看性能問題的流程,先統(tǒng)計,再看具體操作,然后查看代碼,鎖定問題。剩下的就是祝好運咯。當(dāng)然如果發(fā)現(xiàn)輸出比較少,還有個工具是ltrace。
責(zé)任編輯:姜華
來源:
鴻蒙開發(fā)者社區(qū)