對MySQL報警的一次分析處理小結
最近有一個服務出現了報警,已經讓我到了忍無可忍的地步,報警信息如下:
- Metric:mysql.innodb_row_lock_waits Tags:port=4306,service=xxxx diff(#1): 996>900
大概的意思是有一個數據庫監控指標innodb_row_lock_waits 目前超出了閾值900
但是尷尬的是,每次報警后去環境中查看,得到的信息都很有限,慢日志,錯誤日志里面都沒有充分的信息可以分析,一來二去之后,我開始靜下心來分析這個問題的原因。
首先這個報警信息的時間點貌似是有些規律的,我拿著最近幾天的報警時間做了比對,發現還是比較有規律的,那么在系統層面有哪些任務可能會觸發呢,我查找比對了相關的任務配置,發現有一個定時任務每1分鐘會執行一次,但是到了這里疑問就來了,如果每1分鐘執行1次,為什么在特定的時間會產生差異較大的處理結果?當然這個現象的解釋是個起始。
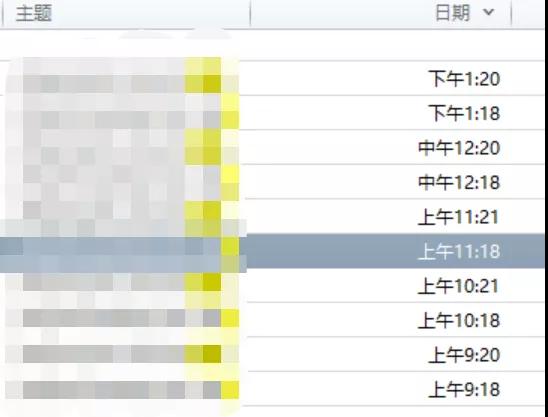
其實要證明這一點還是蠻容易的,今天我就采取了守株待兔的模式,我在臨近報警的時間前后打開了通用日志,從日志輸出來看,操作的頻率還是相對有限的。
很快得到了規律性的報警,于是我開始抓取相關的通用日志記錄,比如11:18分,我們可以采用如下的模式得到相關的日志,首先得到一個臨時的通用日志文件,把各種DML和執行操作都網羅進來。
- cat general.log|grep -E "insert|delete|update|select|exec" > general_tmp.log
我們以11:18分為例,可以在前后1兩分鐘做比對,結果如下:
- # less general_tmp.log |grep "11:18"|wc -l
- 400
- # less general_tmp.log |grep "11:17"|wc -l
- 666
- # less general_tmp.log |grep "11:16"|wc -l
- 15
發現在報警的那1分鐘前后,數量是能夠對得上的。
這個表的數據量有200多萬,表結構如下:
- CREATE TABLE `task_queue` (
- `AccID` bigint(20) NOT NULL AUTO_INCREMENT COMMENT '自增ID',
- `TaskStepID` bigint(20) DEFAULT NULL COMMENT '任務步驟ID task_step_conf',
- `QOrder` int(11) DEFAULT NULL COMMENT '隊列排序 task_step_confi.Step_ID',
- `QState` tinyint(4) DEFAULT '1' COMMENT '隊列狀態 1:待執行 2:執行中 3:執行成功 4:執行失敗',
- `QExcCount` int(11) DEFAULT '1' COMMENT '執行次數',
- `CrtTime` datetime DEFAULT NULL COMMENT '創建時間',
- `ModTime` datetime DEFAULT NULL COMMENT '修改時間',
- PRIMARY KEY (`AccID`),
- KEY `idx_taskstepid` (`TaskStepID`),
- KEY `idx_qstate` (`QState`)
- ) ENGINE=InnoDB AUTO_INCREMENT=3398341 DEFAULT CHARSET=utf8
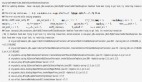
在日志中根據分析和比對,基本能夠鎖定SQL是在一類Update操作上面,SQL的執行計劃如下:
- >>explain update task_queue set QState=1,QExcCount=QExcCount+1,modtime=now() where QState=0 and taskstepid =411\G
- *************************** 1. row ***************************
- id: 1
- select_type: UPDATE
- table: task_queue
- partitions: NULL
- type: index_merge
- possible_keys: idx_taskstepid,idx_qstate
- key: idx_qstate,idx_taskstepid
- key_len: 2,9
- ref: NULL
- rows: 11
- filtered: 100.00
- Extra: Using intersect(idx_qstate,idx_taskstepid); Using where; Using temporary
這個執行結果中key_len是2,9,是和以往的ken_len計算法則不一樣的。 其中Extra列已經給出了明確的提示,這是一個intersect處理,特別的是它是基于二級索引級別的處理,在優化器層面是有一個相關的參數index_merge_intersection。
我們知道在MySQL中主鍵是一等公民,而二級索引最后都會映射到主鍵層面處理,而索引級別的intersect其實有點我們的左右手,左手對應一些數據結果映射到一批主鍵id,右手對應一些數據結果映射到另外一批主鍵id,把兩者的主鍵id值進行intersect交集計算,所以在當前的場景中,索引級別的intersect到底好不好呢?
在此我設想了3個對比場景進行分析,首先這是一個update語句,我們為了保證后續測試的可重復性,可以轉換為一個select語句。
- select * from task_queue where QState=0 and taskstepid =411;
所以我們的對比測試基于查詢語句進行比對分析。
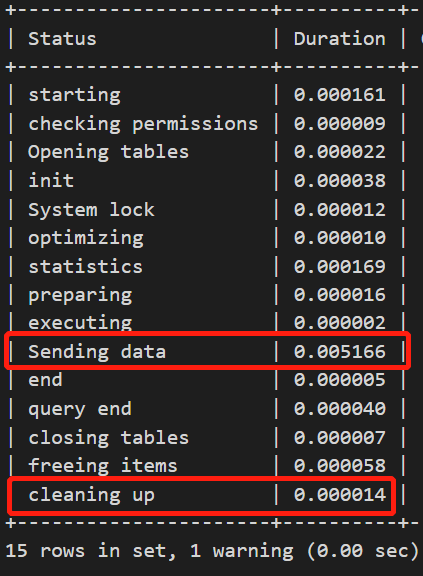
場景1:優化器保持默認index_merge_intersection開啟,基于profile提取執行明細信息
- >explain select * from task_queue where QState=0 and taskstepid =411\G
- *************************** 1. row ***************************
- id: 1
- select_type: SIMPLE
- table: task_queue
- partitions: NULL
- type: index_merge
- possible_keys: idx_qstate,idx_taskstepid
- key: idx_qstate,idx_taskstepid
- key_len: 2,9
- ref: NULL
- rows: 11
- filtered: 100.00
- Extra: Using intersect(idx_qstate,idx_taskstepid); Using where
- 1 row in set, 1 warning (0.00 sec)
profile信息為:
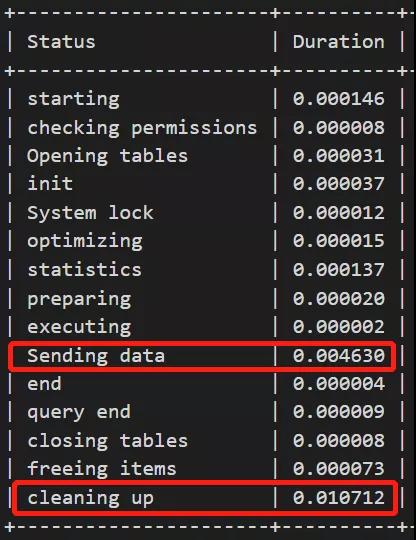
場景2:優化器關閉index_merge_intersection,基于profile進行對比
- >set session optimizer_switch='index_merge_intersection=off';
- >explain select * from task_queue where QState=0 and taskstepid =411\G
- *************************** 1. row ***************************
- id: 1
- select_type: SIMPLE
- table: task_queue
- partitions: NULL
- type: ref
- possible_keys: idx_qstate,idx_taskstepid
- key: idx_qstate
- key_len: 2
- ref: const
- rows: 1451
- filtered: 0.82
- Extra: Using where
- 1 row in set, 1 warning (0.00 sec)
profile信息為:
場景3:重構索引,進行比對分析
根據業務邏輯,如果創建一個復合索引,是能夠大大減少結果集的量級的,同時依然保留idx_qstate索引,使得一些業務依然能夠正常使用。
- >alter table task_queue drop key idx_taskstepid;
- >alter table task_queue add key `idx_taskstepid` (`TaskStepID`,QState);
- explain select * from task_queue where QState=0 and taskstepid =411\G
- *************************** 1. row ***************************
- id: 1
- select_type: SIMPLE
- table: task_queue
- partitions: NULL
- type: ref
- possible_keys: idx_qstate,idx_taskstepid
- key: idx_taskstepid
- key_len: 11
- ref: const,const
- rows: 1
- filtered: 100.00
- Extra: NULL
- 1 row in set, 1 warning (0.00 sec)
profile信息為:
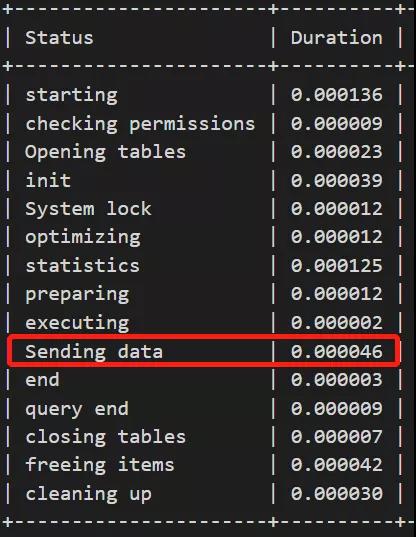
可以明顯看到通過索引重構,“Sending data”的部分少了兩個數量級
所以接下里的事情就是進一步進行分析和驗證,有理有據,等待的過程也不再彷徨,一天過去了,再沒有收到1條報警,再次說明在工作中不要小看這些報警。
本文轉載自微信公眾號「楊建榮的學習筆記」,可以通過以下二維碼關注。轉載本文請聯系楊建榮的學習筆記公眾號。