用了很多年Dubbo,連Dubbo線程池監控都不知道,覺得自己很厲害?
本文轉載自微信公眾號「猿天地」,作者尹吉歡。轉載本文請聯系猿天地公眾號。
前言
micrometer 中自帶了很多其他框架的指標信息,可以很方便的通過 prometheus 進行采集和監控,常用的有 JVM 的信息,Http 請求的信息,Tomcat 線程的信息等。
對于一些比較活躍的框架,有些還是不支持的,比如 Dubbo。如果想監控 Dubbo 的一些指標,比如線程池的狀況,我們需要手動去擴展,輸出對應的線程池指標才行。
在這種情況下,肯定是沒什么思路的,因為你不知道怎么去擴展,下面給大家介紹去做一件事情之前的思考,方式方法很重要。
- Dubbo 有沒有現成的實現?
- 參考 micrometer 中指標的實現,依葫蘆畫瓢?
Dubbo 有沒有現成的實現?
完整的實現應該沒有,至少我還沒用過,也沒有那種去搜索引擎一搜就大把結果的現狀,于是我在 Dubbo 的 Github 上找到了一個相關的項目 dubbo-spring-boot-actuator。
https://github.com/apache/dubbo-spring-boot-project/tree/master/dubbo-spring-boot-actuator
dubbo-spring-boot-actuator 看名稱就知道,提供了 Dubbo 相關的各種信息端點和健康檢查。從這里面也許能發現點有用的代碼。
果不其然,在介紹頁面中看到了想要的內容,線程池的指標數據,只不過是拼接成了字符串顯示而已。
- "threadpool": {
- "source": "management.health.dubbo.status.extras",
- "status": {
- "level": "OK",
- "message": "Pool status:OK, max:200, core:200, largest:0, active:0, task:0, service port: 12345",
- "description": null
- }
- }
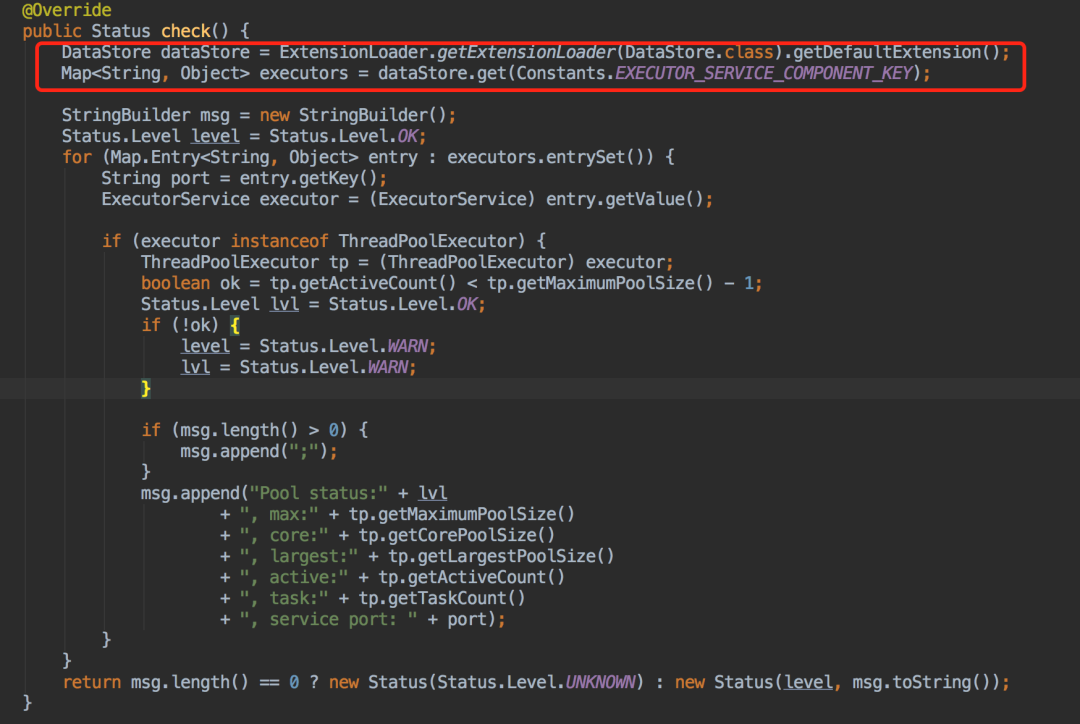
然后就去翻 dubbo-spring-boot-actuator 的代碼了,沒找到線程池這塊的代碼。后面在 dubbo.jar 中找到了 ThreadPoolStatusChecker 這個類,核心邏輯在這里面。現在已經解決了第一個問題,就是獲取到 Dubbo 的線程池對象。
參考 micrometer 中指標的實現,依葫蘆畫瓢?
線程池對象能拿到了,各種數據也就能獲取了。接下來的問題就是如何暴露出去給 prometheus 采集。
兩種方式,一種是自定義一個新的端點暴露,一種是直接在已有的 prometheus 端點中增加指標數據的輸出,也就是依葫蘆畫瓢。
看源碼中已經有很多 Metrics 的實現了,我們也實現一個 Dubbo 線程池的 Metrics 即可。
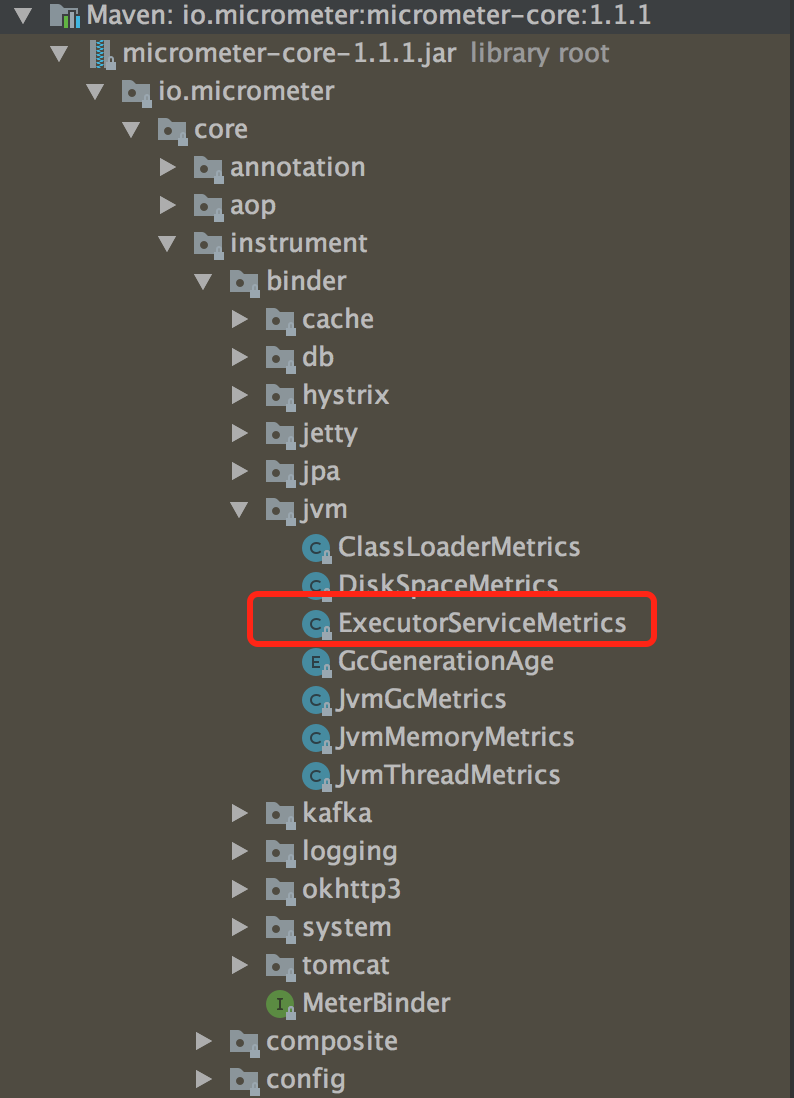
上圖框起來的就是一個已經存在的線程池 Metrics,可以直接復用代碼。
實現的主要邏輯就是實現一個 MeterBinder 接口,然后將你需要的指標進行輸出即可。于是打算在 bindTo 方法中獲取 Dubbo 的線程池對象,然后輸出指標。經過測試,在 MeterBinder 實例化的時候 Dubbo 還沒初始化好,拿不到線程池對象,綁定后無法成功輸出指標。
后面還是打算采用定時采樣的方式來輸出,自定義一個后臺線程,定時去輸出數據。可以用 Timer,我這圖簡單就直接 while 循環了。
- /**
- * Dubbo線程池指標
- *
- * @author yinjihuan
- */
- @Configuration
- public class DubboThreadMetrics {
- @Autowired
- private MeterRegistry meterRegistry;
- private final Iterable<Tag> TAG = Collections.singletonList(Tag.of("thread.pool.name", "dubboThreadPool"));
- @PostConstruct
- public void init() {
- new Thread(() -> {
- while (true) {
- try {
- Thread.sleep(1000);
- } catch (InterruptedException e) {
- e.printStackTrace();
- }
- DataStore dataStore = ExtensionLoader.getExtensionLoader(DataStore.class).getDefaultExtension();
- Map<String, Object> executors = dataStore.get(Constants.EXECUTOR_SERVICE_COMPONENT_KEY);
- for (Map.Entry<String, Object> entry : executors.entrySet()) {
- ExecutorService executor = (ExecutorService) entry.getValue();
- if (executor instanceof ThreadPoolExecutor) {
- ThreadPoolExecutor tp = (ThreadPoolExecutor) executor;
- Gauge.builder("dubbo.thread.pool.core.size", tp, ThreadPoolExecutor::getCorePoolSize)
- .description("核心線程數")
- .baseUnit("threads")
- .register(meterRegistry);
- Gauge.builder("dubbo.thread.pool.largest.size", tp, ThreadPoolExecutor::getLargestPoolSize)
- .description("歷史最高線程數")
- .baseUnit("threads")
- .register(meterRegistry);
- Gauge.builder("dubbo.thread.pool.max.size", tp, ThreadPoolExecutor::getMaximumPoolSize)
- .description("最大線程數")
- .baseUnit("threads")
- .register(meterRegistry);
- Gauge.builder("dubbo.thread.pool.active.size", tp, ThreadPoolExecutor::getActiveCount)
- .description("活躍線程數")
- .baseUnit("threads")
- .register(meterRegistry);
- Gauge.builder("dubbo.thread.pool.thread.count", tp, ThreadPoolExecutor::getPoolSize)
- .description("當前線程數")
- .baseUnit("threads")
- .register(meterRegistry);
- Gauge.builder("dubbo.thread.pool.queue.size", tp, e -> e.getQueue().size())
- .description("隊列大小")
- .baseUnit("threads")
- .register(meterRegistry);
- Gauge.builder("dubbo.thread.pool.taskCount", tp, ThreadPoolExecutor::getTaskCount)
- .description("任務總量")
- .baseUnit("threads")
- .register(meterRegistry);
- Gauge.builder("dubbo.thread.pool.completedTaskCount", tp, ThreadPoolExecutor::getCompletedTaskCount)
- .description("已完成的任務量")
- .baseUnit("threads")
- .register(meterRegistry);
- }
- }
- }
- }).start();
- }
- }
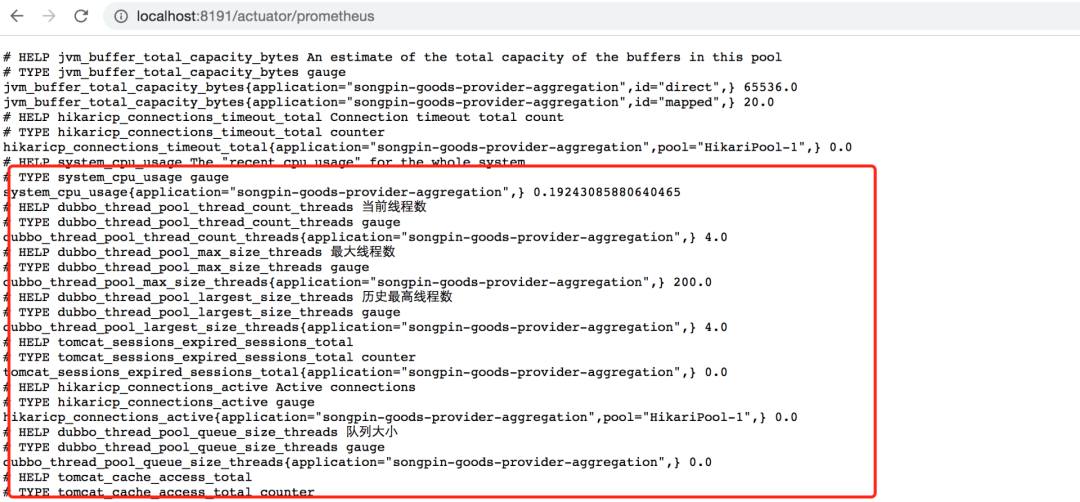
指標信息:
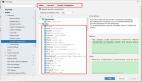
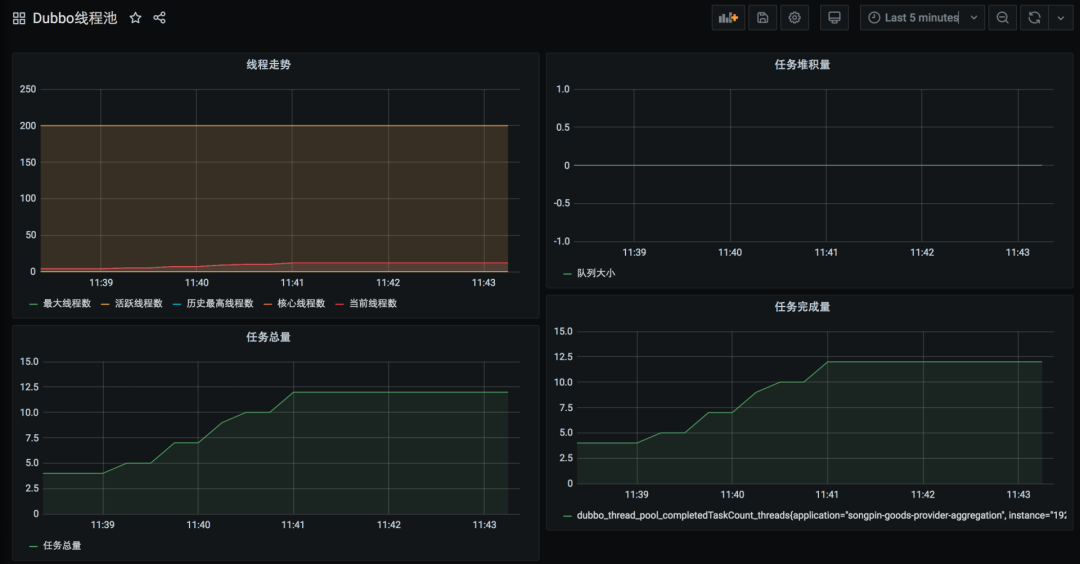
配置線程池圖表
創建一個新的 dashboard 配置圖表,然后新建 panel 配置指標信息
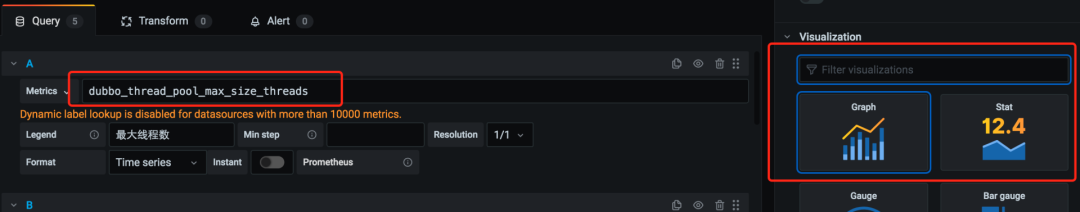
左側配指標信息,右側選擇對應的圖表格式。需要注意的是,如果有多個服務實例,Metrics 這邊最好是根據服務實例來顯示,需要在指標后面增加條件,如下:
- dubbo_thread_pool_max_size_theads{application="$application", instance=~"$instance"}
關于作者:尹吉歡,簡單的技術愛好者,《Spring Cloud 微服務-全棧技術與案例解析》, 《Spring Cloud 微服務 入門 實戰與進階》作者, 公眾號猿天地發起人。
原文鏈接:http://cxytiandi.com/blog/user/1