Pandas做數(shù)據(jù)可視化具體操作,快來(lái)看看吧
常見(jiàn)的數(shù)據(jù)可視化庫(kù)有:
- matplotlib 是最常見(jiàn)的2維庫(kù),可以算作可視化的必備技能庫(kù),由于matplotlib是比較底層的庫(kù),api很多,代碼學(xué)起來(lái)不太容易。
- seaborn 是建構(gòu)于matplotlib基礎(chǔ)上,能滿(mǎn)足絕大多數(shù)可視化需求。更特殊的需求還是需要學(xué)習(xí)matplotlib
- pyecharts 上面的兩個(gè)庫(kù)都是靜態(tài)的可視化庫(kù),而pyecharts有很好的web兼容性,可以做到可視化的動(dòng)態(tài)效果。
但是在數(shù)據(jù)科學(xué)中,幾乎都離不開(kāi)pandas數(shù)據(jù)分析庫(kù),而pandas可以做
- 數(shù)據(jù)采集 如何批量采集網(wǎng)頁(yè)表格數(shù)據(jù)?
- 數(shù)據(jù)讀取 pd.read_csv/pd.read_excel
- 數(shù)據(jù)清洗(預(yù)處理) 理解pandas中的apply和map的作用和異同
- 可視化,兼容matplotlib語(yǔ)法(今天重點(diǎn))
在本文我們可以學(xué)到用pandas做
- 導(dǎo)入數(shù)據(jù)
- 繪制最簡(jiǎn)單的圖plot()
- 多個(gè)y的繪制圖
- 折線圖、條形圖、餅形圖和散點(diǎn)圖繪制
- 統(tǒng)計(jì)信息繪圖
- 箱型圖
- 軸坐標(biāo)刻度
- plot()更多精細(xì)化參數(shù)
- 可視化結(jié)果輸出保存
準(zhǔn)備工作
如果你之前沒(méi)有學(xué)過(guò)pandas和matpltolib,我們先安裝好這幾個(gè)庫(kù)
- !pip3 install numpy!pip3 install pandas!pip3 install matplotlib
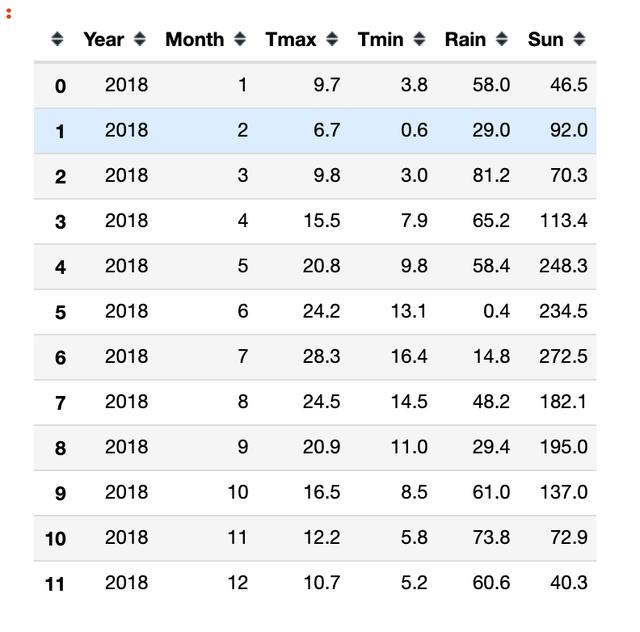
已經(jīng)安裝好,現(xiàn)在我們導(dǎo)入這幾個(gè)要用到的庫(kù)。使用的是倫敦天氣數(shù)據(jù),一開(kāi)始我們只有12個(gè)月的小數(shù)據(jù)作為例子
- #jupyter notebook中需要加這行代碼%matplotlib inlineimport
- matplotlib.pyplot as pltimport numpy as npimport pandas as pd#讀取天
- 氣數(shù)據(jù)df = pd.read_csv('data/london2018.csv')df
plot最簡(jiǎn)單的圖
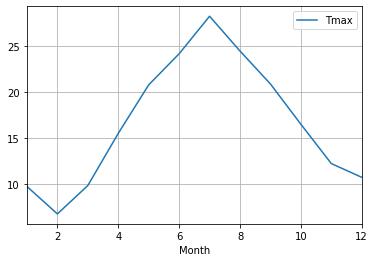
選擇Month作為橫坐標(biāo),Tmax作為縱坐標(biāo),繪圖。
大家注意下面兩種寫(xiě)法
- #寫(xiě)法1df.plot(x='Month', y='Tmax')plt.show()
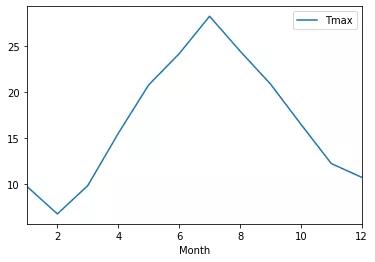
- 橫坐標(biāo)軸參數(shù)x傳入的是df中的列名Month
- 縱坐標(biāo)軸參數(shù)y傳入的是df中的列名Tmax
- 折線圖
上面的圖就是折線圖,折線圖語(yǔ)法有三種
- df.plot(x='Month', y='Tmax')
- df.plot(x='Month', y='Tmax', kind='line')
- df.plot.line(x='Month', y='Tmax')
- df.plot.line(x='Month', y='Tmax')plt.show()
- #grid繪制格線df.plot(x='Month', y='Tmax', kind='line',
- grid=True)plt.show()
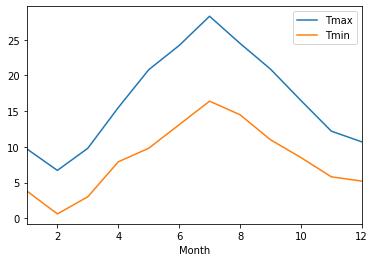
多個(gè)y值
上面的折線圖中只有一條線, 如何將多個(gè)y繪制到一個(gè)圖中
比如Tmax, Tmin
- df.plot(x='Month', y=['Tmax', 'Tmin'])plt.show()
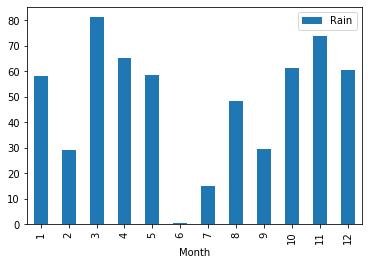
條形圖
- df.plot(x='Month', y='Rain', kind='bar')#同樣還可以這樣
- 畫(huà)#df.plot.bar(x='Month', y='Rain')plt.show()
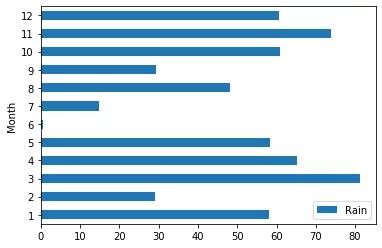
水平條形圖
bar環(huán)衛(wèi)barh,就可以將條形圖變?yōu)樗綏l形圖
- df.plot(x='Month', y='Rain', kind='barh')#同樣還可以這
- 樣畫(huà)#df.plot.bar(x='Month', y='Rain')plt.show()
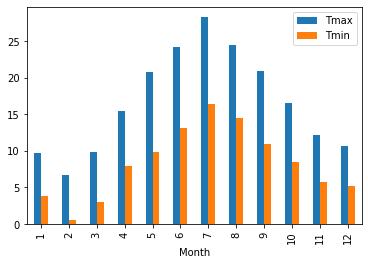
多個(gè)變量的條形圖
- df.plot(kind='bar', x = 'Month', y=['Tmax', 'Tmin'])plt.show()
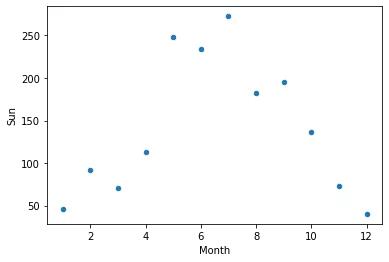
散點(diǎn)圖
- df.plot(kind='scatter', x = 'Month', y = 'Sun')plt.show()
餅形圖
- df.plot(kind='pie', y='Sun')plt.show()
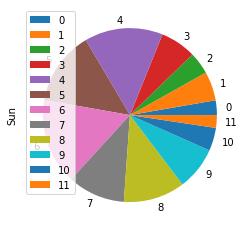
上圖繪制有兩個(gè)小問(wèn)題:
- legend圖例不應(yīng)該顯示
- 月份的顯示用數(shù)字不太正規(guī)
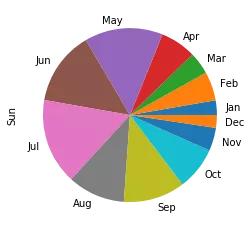
- df.index =
- ['Jan','Feb','Mar','Apr','May','Jun','Jul','Aug','Sep','Oct','Nov','D
- ec']df.plot(kind='pie', y = 'Sun', legend=False)plt.show()
更多數(shù)據(jù)
一開(kāi)頭的數(shù)據(jù)只有12條記錄(12個(gè)月)的數(shù)據(jù),現(xiàn)在我們用更大的倫敦天氣數(shù)據(jù)
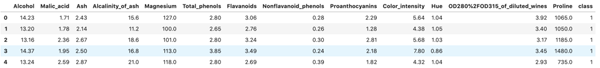
- import pandas as pddf2 = pd.read_csv('data/londonweather.csv')df2.head()
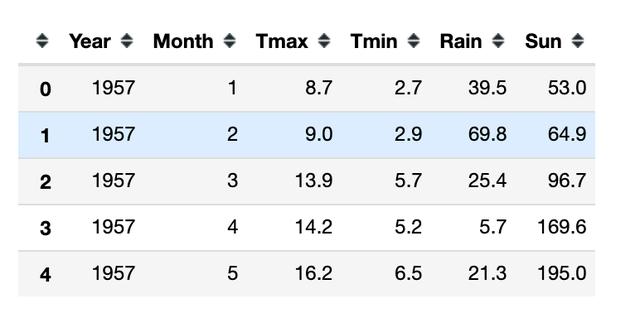
- df2.Rain.describe()
- count 748.000000mean 50.408957std 29.721493min
- 0.30000025% 27.80000050% 46.10000075%
- 68.800000max 174.800000Name: Rain, dtype: float64
上面一共有748條記錄, 即62年的記錄。
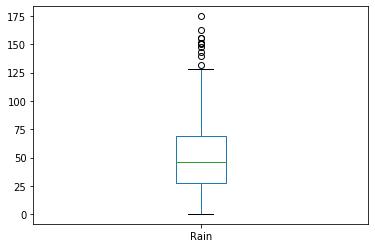
箱型圖
- df2.plot.box(y='Rain')#df2.plot(y='Rain', kind='box')plt.show()
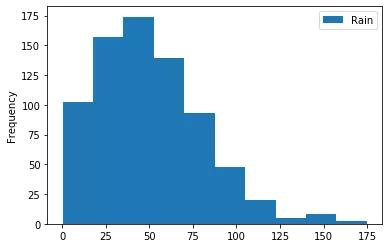
直方圖
- df2.plot(y='Rain', kind='hist')#df2.plot.hist(y='Rain')plt.show()
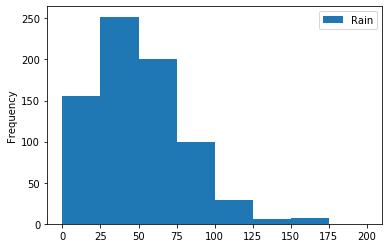
縱坐標(biāo)的刻度可以通過(guò)bins設(shè)置
- df2.plot(y='Rain', kind='hist', bins=[0,25,50,75,100,125,150,175,
- 200])#df2.plot.hist(y='Rain')plt.show()
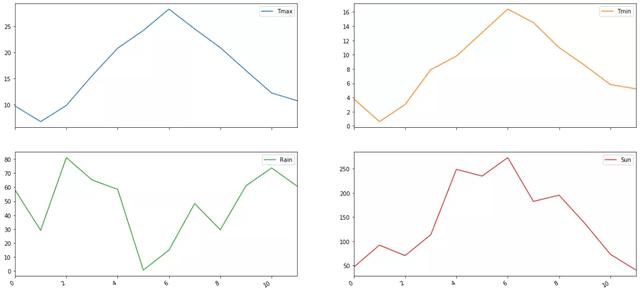
多圖并存
- df.plot(kind='line', y=['Tmax', 'Tmin', 'Rain', 'Sun'], #4個(gè)
- 變量可視化 subplots=True, #多子圖并存 layout=(2,
- 2), #子圖排列2行2列 figsize=(20, 10)) #圖布的尺寸plt.show()
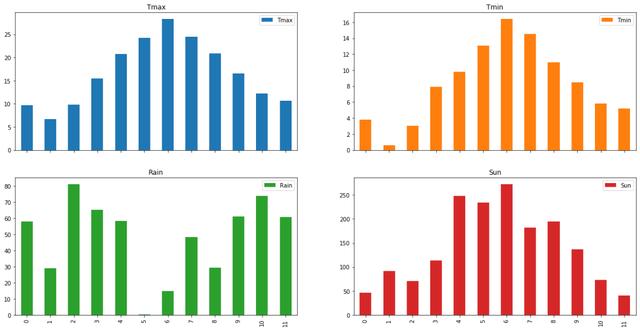
- df.plot(kind='bar', y=['Tmax', 'Tmin', 'Rain', 'Sun'], #4個(gè)變
- 量可視化 subplots=True, #多子圖并存 layout=(2, 2),
- #子圖排列2行2列 figsize=(20, 10)) #圖布的尺寸plt.show()
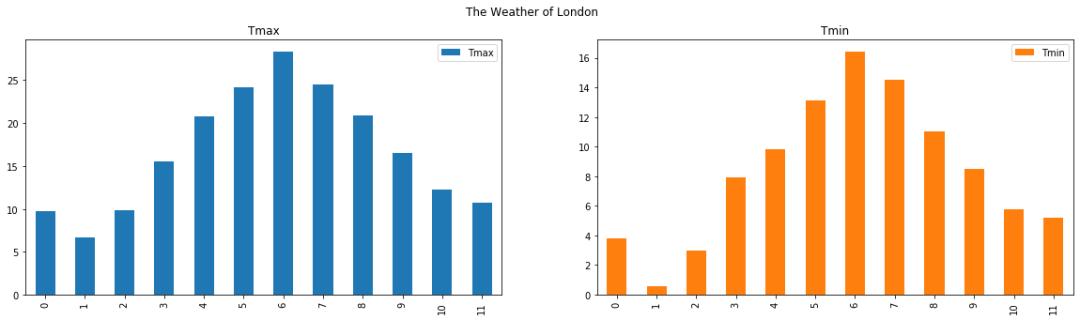
加標(biāo)題
給可視化起個(gè)標(biāo)題
- df.plot(kind='bar', y=['Tmax', 'Tmin'], #2個(gè)變量可視化
- subplots=True, #多子圖并存 layout=(1, 2), #子圖排列1
- 行2列 figsize=(20, 5),#圖布的尺寸 title='The Weather
- of London') #標(biāo)題plt.show()
保存結(jié)果
可視化的結(jié)果可以存儲(chǔ)為圖片文件
- df.plot(kind='pie', y='Rain', legend=False, figsize=(10, 5), title='Pie of Weather in London')plt.savefig('img/pie.png')plt.show()

df.plot更多參數(shù)
df.plot(x, y, kind, figsize, title, grid, legend, style)
- x 只有dataframe對(duì)象時(shí),x可用。橫坐標(biāo)
- y 同上,縱坐標(biāo)變量
- kind 可視化圖的種類(lèi),如line,hist, bar, barh, pie, kde, scatter
- figsize 畫(huà)布尺寸
- title 標(biāo)題
- grid 是否顯示格子線條
- legend 是否顯示圖例
- style 圖的風(fēng)格
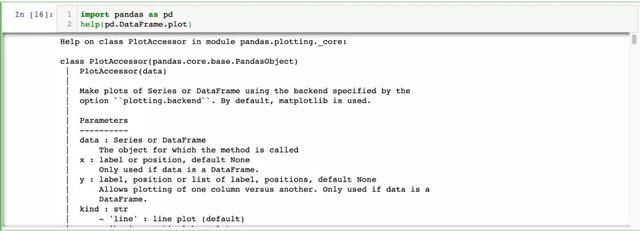
- 查看plot參數(shù)可以使用help
- import pandas as pdhelp(pd.DataFrame.plot)