MySQL高性能學習筆記
一、Ubuntu 安裝mysql
我們在Ubuntu環境下裝一個測試用的MySQL來學習。
1.更新包
- sudo apt-get update
2.安裝MySQL的服務端和客戶端
- sudo apt-get install mysql-server mysql-client
在安裝的過程中,需要輸入數據庫密碼。
3.啟動Mysql
- sudo service mysql restart
4.登錄mysql
- mysql -u root -p
二、sysbench基準測試
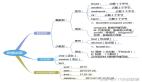
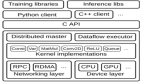
sysbench是一個開源的、模塊化的、跨平臺的多線程性能測試工具,可以用來進行CPU、內存、磁盤I/O、線程、數據庫的性能測試。目前支持的數據庫有MySQL、Oracle和PostgreSQL。當前功能允許測試的系統參數有:
file I/O performance (文件I / O性能)
scheduler performance (調度性能)
memory allocation and transfer speed (內存分配和傳輸速度)
POSIX threads implementation performance (POSIX線程執行績效)
database server performance (OLTP benchmark) (數據庫服務器性能)
1.安裝
Ubuntu系統可以直接apt,如:
- apt-get install sysbench
在安裝的時候出現了這樣的錯誤:Could not get lock /var/lib/dpkg/lock
出現這個問題可能是有另外一個程序正在運行,導致資源被鎖不可用。而導致資源被鎖的原因可能是上次運行安裝或更新時沒有正常完成,進而出現此狀況,解決的辦法其實很簡單:
在終端中敲入以下兩句
- sudo rm /var/cache/apt/archives/lock
- sudo rm /var/lib/dpkg/lock
再試著安裝,問題解決。
2.通用選項說明
- root@db2:~# sysbench
- Missing required command argument.
Usage: #使用方法
- sysbench [general-options]... --test=<test-name> [test-options]... command
General options: #通用選項
--num-threads=N number of threads to use [1] #創建測試線程的數目。默認為1.
--max-requests=N limit for total number of requests [10000] #請求的最大數目。默認為10000,0代表不限制。
--max-time=N limit for total execution time in seconds [0] #最大執行時間,單位是s。默認是0,不限制。
--forced-shutdown=STRING amount of time to wait after --max-time before forcing shutdown [off] #超過max-time強制中斷。默認是off。
--thread-stack-size=SIZE size of stack per thread [32K] #每個線程的堆棧大小。默認是32K。
--init-rng=[on|off] initialize random number generator [off] #在測試開始時是否初始化隨機數發生器。默認是off。
--test=STRING test to run #指定測試項目名稱。
--debug=[on|off] print more debugging info [off] #是否顯示更多的調試信息。默認是off。
--validate=[on|off] perform validation checks where possible [off] #在可能情況下執行驗證檢查。默認是off。
--help=[on|off] print help and exit #幫助信息。
--version=[on|off] print version and exit #版本信息。
Compiled-in tests: #測試項目
fileio - File I/O test #IO
cpu - CPU performance test #CPU
memory - Memory functions speed test #內存
threads - Threads subsystem performance test #線程
mutex - Mutex performance test #互斥性能測試
oltp - OLTP test # 數據庫,事務處理
Commands: prepare:測試前準備工作; run:正式測試 cleanup:測試后刪掉測試數據 help version
See 'sysbench --test=<name> help' for a list of options for each test. #查看每個測試項目的更多選項列表
更多選項:
1):sysbench --test=fileio help
- root@db2:~# sysbench --test=fileio help
- sysbench 0.4.12: multi-threaded system evaluation benchmark
fileio options:
--file-num=N 創建測試文件的數量。默認是128
--file-block-size=N 測試時文件塊的大小。默認是16384(16K)
--file-total-size=SIZE 測試文件的總大小。默認是2G
--file-test-mode=STRING 文件測試模式{seqwr(順序寫), seqrewr(順序讀寫), seqrd(順序讀), rndrd(隨機讀), rndwr(隨機寫), rndrw(隨機讀寫)}
--file-io-mode=STRING 文件操作模式{sync(同步),async(異步),fastmmap(快速map映射),slowmmap(慢map映射)}。默認是sync
--file-extra-flags=STRING 使用額外的標志來打開文件{sync,dsync,direct} 。默認為空
--file-fsync-freq=N 執行fsync()的頻率。(0 – 不使用fsync())。默認是100
--file-fsync-all=[on|off] 每執行完一次寫操作就執行一次fsync。默認是off
--file-fsync-end=[on|off] 在測試結束時才執行fsync。默認是on
--file-fsync-mode=STRING 使用哪種方法進行同步{fsync, fdatasync}。默認是fsync
--file-merged-requests=N 如果可以,合并最多的IO請求數(0 – 表示不合并)。默認是0
--file-rw-ratio=N 測試時的讀寫比例。默認是1.5
2):sysbench --test=cpu help
--cpu-max-prime=N 最大質數發生器數量。默認是10000
3):sysbench --test=memory help
- root@db2:~# sysbench --test=memory help
- sysbench 0.4.12: multi-threaded system evaluation benchmark
memory options:
--memory-block-size=SIZE 測試時內存塊大小。默認是1K
--memory-total-size=SIZE 傳輸數據的總大小。默認是100G
--memory-scope=STRING 內存訪問范圍{global,local}。默認是global
--memory-hugetlb=[on|off] 從HugeTLB池內存分配。默認是off
--memory-oper=STRING 內存操作類型。{read, write, none} 默認是write
--memory-access-mode=STRING存儲器存取方式{seq,rnd} 默認是seq
4):sysbench --test=threads help
sysbench 0.4.12: multi-threaded system evaluation benchmark
threads options:
--thread-yields=N 每個請求產生多少個線程。默認是1000
--thread-locks=N 每個線程的鎖的數量。默認是8
5):sysbench --test=mutex help
- root@db2:~# sysbench --test=mutex help
- sysbench 0.4.12: multi-threaded system evaluation benchmark
mutex options:
--mutex-num=N 數組互斥的總大小。默認是4096
--mutex-locks=N 每個線程互斥鎖的數量。默認是50000
--mutex-loops=N 內部互斥鎖的空循環數量。默認是10000
6): sysbench --test=oltp help
- root@db2:~# sysbench --test=oltp help
- sysbench 0.4.12: multi-threaded system evaluation benchmark
oltp options:
--oltp-test-mode=STRING 執行模式{simple,complex(advanced transactional),nontrx(non-transactional),sp}。默認是complex
--oltp-reconnect-mode=STRING 重新連接模式{session(不使用重新連接。每個線程斷開只在測試結束),transaction(在每次事務結束后重新連接),query(在每個SQL語句執行完重新連接),random(對于每個事務隨機選擇以上重新連接模式)}。默認是session
--oltp-sp-name=STRING 存儲過程的名稱。默認為空
--oltp-read-only=[on|off] 只讀模式。Update,delete,insert語句不可執行。默認是off
--oltp-skip-trx=[on|off] 省略begin/commit語句。默認是off
--oltp-range-size=N 查詢范圍。默認是100
--oltp-point-selects=N number of point selects [10]
--oltp-simple-ranges=N number of simple ranges [1]
--oltp-sum-ranges=N number of sum ranges [1]
--oltp-order-ranges=N number of ordered ranges [1]
--oltp-distinct-ranges=N number of distinct ranges [1]
--oltp-index-updates=N number of index update [1]
--oltp-non-index-updates=N number of non-index updates [1]
--oltp-nontrx-mode=STRING 查詢類型對于非事務執行模式{select, update_key, update_nokey, insert, delete} [select]
--oltp-auto-inc=[on|off] AUTO_INCREMENT是否開啟。默認是on
--oltp-connect-delay=N 在多少微秒后連接數據庫。默認是10000
--oltp-user-delay-min=N 每個請求最短等待時間。單位是ms。默認是0
--oltp-user-delay-max=N 每個請求最長等待時間。單位是ms。默認是0
--oltp-table-name=STRING 測試時使用到的表名。默認是sbtest
--oltp-table-size=N 測試表的記錄數。默認是10000
--oltp-dist-type=STRING 分布的隨機數{uniform(均勻分布),Gaussian(高斯分布),special(空間分布)}。默認是special
--oltp-dist-iter=N 產生數的迭代次數。默認是12
--oltp-dist-pct=N 值的百分比被視為'special' (for special distribution)。默認是1
--oltp-dist-res=N ‘special’的百分比值。默認是75
General database options:
--db-driver=STRING 指定數據庫驅動程序('help' to get list of available drivers)
--db-ps-mode=STRING編制報表使用模式{auto, disable} [auto]
Compiled-in database drivers:
- mysql - MySQL driver
mysql options:
--mysql-host=[LIST,...] MySQL server host [localhost]
--mysql-port=N MySQL server port [3306]
--mysql-socket=STRING MySQL socket
--mysql-user=STRING MySQL user [sbtest]
--mysql-password=STRING MySQL password []
--mysql-db=STRING MySQL database name [sbtest]
--mysql-table-engine=STRING storage engine to use for the test table {myisam,innodb,bdb,heap,ndbcluster,federated} [innodb]
--mysql-engine-trx=STRING whether storage engine used is transactional or not {yes,no,auto} [auto]
--mysql-ssl=[on|off] use SSL connections, if available in the client library [off]
--myisam-max-rows=N max-rows parameter for MyISAM tables [1000000]
--mysql-create-options=STRING additional options passed to CREATE TABLE []
3.測試線程
- sysbench --test=threads --num-threads=500 --thread-yields=100 --thread-locks=4 run
4.測試IO
--num-threads 開啟的線程 --file-total-size 總的文件大小
1,prepare階段,生成需要的測試文件,完成后會在當前目錄下生成很多小文件。
- sysbench --test=fileio --num-threads=16 --file-total-size=2G --file-test-mode=rndrw prepare
2,run階段
- sysbench --test=fileio --num-threads=20 --file-total-size=2G --file-test-mode=rndrw run
下面的命令運行文件 I/O 混合隨機讀/寫基準測試:
- sysbench --test=fileio --file-total-size=3G --file-test-mode=rndrw --max-time=300 --max-requests=0 run
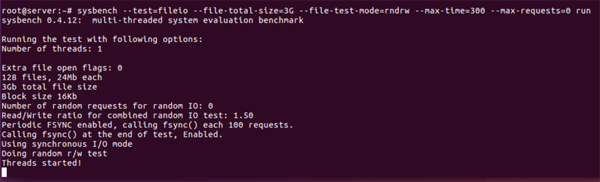
執行結果:
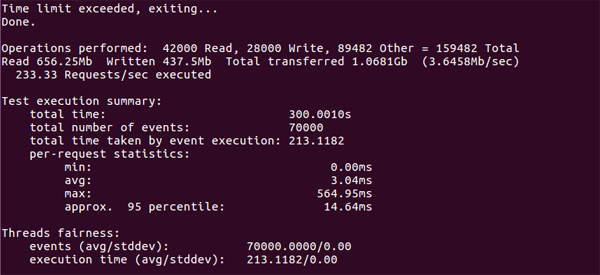
輸出結果分析:
每秒請求數是:233.33 Requests/sec
吞吐量是:3.6458Mb/sec
清除運行文件:
- sysbench --test=fileio --file-total-size=3G cleanup
5.清理測試時生成的文件
- sysbench --test=fileio --num-threads=20 --file-total-size=2G --file-test-mode=rndrw cleanup
6.測試內存
- sysbench --test=memory --memory-block-size=8k --memory-total-size=1G run
7.測試mutex
- sysbench –test=mutex –num-threads=100 –mutex-num=1000 –mutex-locks=100000 –mutex-loops=10000 run
8.測試OLTP
1,prepare階段,生成需要的測試表
- sysbench --test=oltp --mysql-table-engine=innodb --mysql-host=192.168.X.X --mysql-db=test --oltp-table-size=500000 --mysql-user=root --mysql-password=123456 prepare
2,run階段
- sysbench --num-threads=16 --test=oltp --mysql-table-engine=innodb --mysql-host=192.168.x.x --mysql-db=test --oltp-table-size=500000 --mysql-user=root --mysql-password=123456 run
3,清理測試時生成的測試表
- sysbench --num-threads=16 --test=oltp --mysql-table-engine=innodb --mysql-host=192.168.x.x --mysql-db=test --oltp-table-size=500000 --mysql-user=root --mysql-password=123456 cleanup
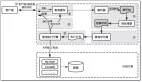
三、服務器性能剖析
我們實際開發中,最常碰到三個性能相關的服務器請求:
1、如何確認服務器是否達到了性能最佳的狀態;
2、找出某條語句為什么執行不夠快
3、診斷被用戶描述成“停頓”、“堆積”或“卡死”的某些間歇性疑難故障
找到慢的原因,我們才能夠對癥下藥。
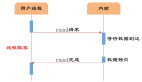
1、何為性能?
我們將性能定義為完成某件任務所需要的時間度量,換句話說,性能即響應時間。
完成一項任務所需要的時間可以分成兩部分:執行時間和等待時間。
2、測量PHP應用程序
這里我們用一個PHP性能剖析工具,名叫ifP(instrumentation-for-php),代碼托管在Google Code上(https://code.google.com/archi...),該工具可以更好的關注數據庫的調用。所以當無法在數據庫層面進行測試的時候,Ifp可以很好的幫助應用剖析數據庫的利用率。Ifp是一個提供了計數器和計時器的單例類,很容易部署到生產環境中,因為不需要訪問PHP的配置權限(因為對于很多開發人員來說,都沒有訪問PHP的配置的權限。)
- error_reporting(-1);
- require_once('../src/Instrumentation.php');
- $instance = false;
- $ret = Instrumentation::get_instance()->start_request();
- print_r($ret);