Linux常用性能分析命令
作者:waylau
本文介紹Linux常用性能分析的命令。
性能分析
vmstat
虛擬內(nèi)存統(tǒng)計(jì)
用法
- Usage:
- vmstat [options] [delay [count]]
- Options:
- -a, --active active/inactive memory
- -f, --forks number of forks since boot
- -m, --slabs slabinfo
- -n, --one-header do not redisplay header
- -s, --stats event counter statistics
- -d, --disk disk statistics
- -D, --disk-sum summarize disk statistics
- -p, --partition <dev> partition specific statistics
- -S, --unit <char> define display unit
- -w, --wide wide output
- -t, --timestamp show timestamp
- -h, --help display this help and exit
- -V, --version output version information and exit
示例
- [root@localhost ~]# vmstat
- procs -----------memory---------- ---swap-- -----io---- -system-- ------cpu-----
- r b swpd free buff cache si so bi bo in cs us sy id wa st
- 0 0 71256 92720 0 565120 0 0 1 115 22 36 1 0 99 0 0
其中
- r : 運(yùn)行和等待 CPU 時(shí)間片的進(jìn)程數(shù)。若該值大于系統(tǒng) CPU 個(gè)數(shù),則說(shuō)明 CPU 不足
- b : 表示等待資源的進(jìn)程數(shù)
- swpd : 切換到內(nèi)存交換區(qū)的內(nèi)存大小(單位 KB)
- free: 空閑的物理內(nèi)存的大小,我的機(jī)器內(nèi)存總共2G,剩余92M。
- buff: Linux/Unix系統(tǒng)是用來(lái)存儲(chǔ),目錄里面有什么內(nèi)容,權(quán)限等的緩存
- cache:直接用來(lái)記憶我們打開的文件,給文件做緩沖,把空閑的物理內(nèi)存的一部分拿來(lái)做文件和目錄的緩存,是為了提高 程序執(zhí)行的性能,當(dāng)程序使用內(nèi)存時(shí),buffer/cached會(huì)很快地被使用
- si:每秒從磁盤讀入虛擬內(nèi)存的大小,如果這個(gè)值大于0,表示物理內(nèi)存不夠用或者內(nèi)存泄露了,要查找耗內(nèi)存進(jìn)程解決掉。
- so:每秒虛擬內(nèi)存寫入磁盤的大小,如果這個(gè)值大于0,同上。
- bi:塊設(shè)備每秒接收的塊數(shù)量(讀磁盤)(kb/s)
- bo:塊設(shè)備每秒發(fā)送的塊數(shù)量(寫磁盤)(kb/s)
- in:每秒CPU的中斷次數(shù),包括時(shí)間中斷
- cs:每秒上下文切換次數(shù)。
- us:用戶進(jìn)程消耗 CPU 時(shí)間百分比
- sy:內(nèi)核進(jìn)程消耗 CPU 時(shí)間百分比,sy 的值較高時(shí),則說(shuō)明內(nèi)核消耗的 CPU 資源很多
- id:空閑 CPU 時(shí)間百分比
- wt:IO 等待 CPU 時(shí)間百分比
free
內(nèi)存使用狀況
- [root@localhost ~]# free
- total used free shared buff/cache available
- Mem: 1849336 1193336 90344 1752 565656 460000
- Swap: 2097148 71248 2025900
- [root@localhost ~]# free -h
- total used free shared buff/cache available
- Mem: 1.8G 1.1G 88M 1.7M 552M 449M
- Swap: 2.0G 69M 1.9G
- [root@localhost ~]# free -m
- total used free shared buff/cache available
- Mem: 1805 1165 88 1 552 449
- Swap: 2047 69 1978
- [root@localhost ~]# free -h 2
- total used free shared buff/cache available
- Mem: 1.8G 1.1G 88M 1.7M 552M 449M
- Swap: 2.0G 69M 1.9G
- [root@localhost ~]# free -h -s 2
- total used free shared buff/cache available
- Mem: 1.8G 1.1G 88M 1.7M 552M 449M
- Swap: 2.0G 69M 1.9G
- total used free shared buff/cache available
- Mem: 1.8G 1.1G 88M 1.7M 552M 449M
- Swap: 2.0G 69M 1.9G
- total used free shared buff/cache available
- Mem: 1.8G 1.1G 88M 1.7M 552M 449M
- Swap: 2.0G 69M 1.9G
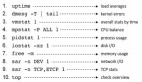
uptime
統(tǒng)計(jì)當(dāng)前系統(tǒng)的運(yùn)行情況
- [root@localhost ~]# uptime
- 09:59:55 up 2 days, 7 min, 1 user, load average: 0.00, 0.01, 0.05
- load average: 系統(tǒng) 1分鐘,5分鐘,15分鐘的平均負(fù)荷
netstat
當(dāng)前網(wǎng)絡(luò)信息
用法
- usage: netstat [-vWeenNcCF] [<Af>] -r netstat {-V|--version|-h|--help}
- netstat [-vWnNcaeol] [<Socket> ...]
- netstat { [-vWeenNac] -I[<Iface>] | [-veenNac] -i | [-cnNe] -M | -s [-6tuw] } [delay]
- -r, --route display routing table
- -I, --interfaces=<Iface> display interface table for <Iface>
- -i, --interfaces display interface table
- -g, --groups display multicast group memberships
- -s, --statistics display networking statistics (like SNMP)
- -M, --masquerade display masqueraded connections
- -v, --verbose be verbose
- -W, --wide don't truncate IP addresses
- -n, --numeric don't resolve names
- --numeric-hosts don't resolve host names
- --numeric-ports don't resolve port names
- --numeric-users don't resolve user names
- -N, --symbolic resolve hardware names
- -e, --extend display other/more information
- -p, --programs display PID/Program name for sockets
- -o, --timers display timers
- -c, --continuous continuous listing
- -l, --listening display listening server sockets
- -a, --all display all sockets (default: connected)
- -F, --fib display Forwarding Information Base (default)
- -C, --cache display routing cache instead of FIB
- -Z, --context display SELinux security context for sockets
- <Socket>={-t|--tcp} {-u|--udp} {-U|--udplite} {-w|--raw} {-x|--unix}
- --ax25 --ipx --netrom
- <AF>=Use '-6|-4' or '-A <af>' or '--<af>'; default: inet
- List of possible address families (which support routing):
- inet (DARPA Internet) inet6 (IPv6) ax25 (AMPR AX.25)
- netrom (AMPR NET/ROM) ipx (Novell IPX) ddp (Appletalk DDP)
- x25 (CCITT X.25)
其中
- -a (all)顯示所有選項(xiàng),默認(rèn)不顯示LISTEN相關(guān)
- -t (tcp)僅顯示tcp相關(guān)選項(xiàng)
- -u (udp)僅顯示udp相關(guān)選項(xiàng)
- -n 拒絕顯示別名,能顯示數(shù)字的全部轉(zhuǎn)化成數(shù)字
- -l 僅列出有在 Listen (監(jiān)聽) 的服務(wù)狀態(tài)
- -p 顯示建立相關(guān)鏈接的程序名
- -r 顯示路由信息,路由表
- -e 顯示擴(kuò)展信息,例如uid等
- -s 按各個(gè)協(xié)議進(jìn)行統(tǒng)計(jì)
- -c 每隔一個(gè)固定時(shí)間,執(zhí)行該netstat命令。
提示:LISTEN和LISTENING的狀態(tài)只有用-a或者-l才能看到
top
- [root@localhost java_demos]# top
- top - 14:36:14 up 2 days, 4:43, 1 user, load average: 0.00, 0.01, 0.05
- Tasks: 110 total, 2 running, 108 sleeping, 0 stopped, 0 zombie
- %Cpu(s): 0.3 us, 0.2 sy, 0.0 ni, 99.3 id, 0.2 wa, 0.0 hi, 0.0 si, 0.0 st
- KiB Mem : 1849336 total, 963348 free, 542372 used, 343616 buff/cache
- KiB Swap: 2097148 total, 2011496 free, 85652 used. 1126908 avail Mem
- PID USER PR NI VIRT RES SHR S %CPU %MEM TIME+ COMMAND
- 1858 mysql 20 0 1465504 200800 6212 S 1.0 10.9 34:56.46 mysqld
- 1 root 20 0 56636 4308 2808 S 0.0 0.2 0:02.05 systemd
- 2 root 20 0 0 0 0 S 0.0 0.0 0:00.04 kthreadd
- 3 root 20 0 0 0 0 S 0.0 0.0 0:01.53 ksoftirqd/0
- 5 root 0 -20 0 0 0 S 0.0 0.0 0:00.00 kworker/0:0H
- 7 root rt 0 0 0 0 S 0.0 0.0 0:00.07 migration/0
- 8 root 20 0 0 0 0 S 0.0 0.0 0:00.00 rcu_bh
- 9 root 20 0 0 0 0 S 0.0 0.0 0:00.00 rcuob/0
- 10 root 20 0 0 0 0 S 0.0 0.0 0:00.00 rcuob/1
- 11 root 20 0 0 0 0 S 0.0 0.0 0:00.00 rcuob/2
- 12 root 20 0 0 0 0 S 0.0 0.0 0:00.00 rcuob/3
- 13 root 20 0 0 0 0 S 0.0 0.0 0:14.63 rcu_sched
- 14 root 20 0 0 0 0 S 0.0 0.0 0:10.43 rcuos/0
- 15 root 20 0 0 0 0 S 0.0 0.0 0:04.67 rcuos/1
其中
***行:
- 14:36:14 當(dāng)前系統(tǒng)時(shí)間
- days, 4:43 系統(tǒng)已經(jīng)運(yùn)行了2天4小時(shí)43分鐘(在這期間沒有重啟過(guò))
- 1 users 當(dāng)前有1個(gè)用戶登錄系統(tǒng)
- load average: 0.00, 0.01, 0.05 ,后面的三個(gè)數(shù)分別是1分鐘、5分鐘、15分鐘的負(fù)載情況。load average數(shù)據(jù)是每隔5秒鐘檢查一次活躍的進(jìn)程數(shù),然后按特定算法計(jì)算出的數(shù)值。如果這個(gè)數(shù)除以邏輯CPU的數(shù)量,結(jié)果高于5的時(shí)候就表明系統(tǒng)在超負(fù)荷運(yùn)轉(zhuǎn)了。
第二行:Tasks 任務(wù)(進(jìn)程),
- 系統(tǒng)現(xiàn)在共有10個(gè)進(jìn)程,其中處于運(yùn)行中的有2個(gè),108個(gè)在休眠(sleep),stoped狀態(tài)的有0個(gè),zombie狀態(tài)(僵尸)的有0個(gè)。
第三行:cpu狀態(tài)
- us 用戶空間占用CPU的百分比
- sy 內(nèi)核空間占用CPU的百分比
- ni 改變過(guò)優(yōu)先級(jí)的進(jìn)程占用CPU的百分比
- id 空閑CPU百分比
- wa IO等待占用CPU的百分比
- hi 硬中斷(Hardware IRQ)占用CPU的百分比
- si 軟中斷(Software Interrupts)占用CPU的百分比
第四行:內(nèi)存狀態(tài)
- total 物理內(nèi)存總量
- free 空閑內(nèi)存總量
- used 使用中的內(nèi)存總量
- buff/cache 緩存的內(nèi)存量
第五行:swap交換分區(qū)
- total 交換區(qū)總量
- free 空閑交換區(qū)總量
- used 使用的交換區(qū)總量
- avail Mem 緩沖的交換區(qū)總量
第六行:各進(jìn)程(任務(wù))的狀態(tài)監(jiān)控
- PID 進(jìn)程id
- USER 進(jìn)程所有者
- PR 進(jìn)程優(yōu)先級(jí)
- NI nice值。負(fù)值表示高優(yōu)先級(jí),正值表示低優(yōu)先級(jí)
- VIRT 進(jìn)程使用的虛擬內(nèi)存總量,單位kb。VIRT=SWAP+RES
- RES 進(jìn)程使用的、未被換出的物理內(nèi)存大小,單位kb。RES=CODE+DATA
- SHR 共享內(nèi)存大小,單位kb
- S 進(jìn)程狀態(tài)。D=不可中斷的睡眠狀態(tài) R=運(yùn)行 S=睡眠 T=跟蹤/停止 Z=僵尸進(jìn)程
- %CPU 上次更新到現(xiàn)在的CPU時(shí)間占用百分比
- %MEM 進(jìn)程使用的物理內(nèi)存百分比
- TIME+ 進(jìn)程使用的CPU時(shí)間總計(jì),單位1/100秒
- COMMAND 進(jìn)程名稱(命令名/命令行)
監(jiān)控java線程數(shù):
- ps -eLf grep java wc -l
監(jiān)控網(wǎng)絡(luò)客戶連接數(shù):
- netstat -n grep tcp grep 偵聽端口 wc -l
責(zé)任編輯:龐桂玉
來(lái)源:
計(jì)算機(jī)與網(wǎng)絡(luò)安全